My TradingView Scripts
All scripts are published as protected scripts (TradingView is not allowing to publish them publicly). So you have to click on the link and add it as favorite indicator to use it.
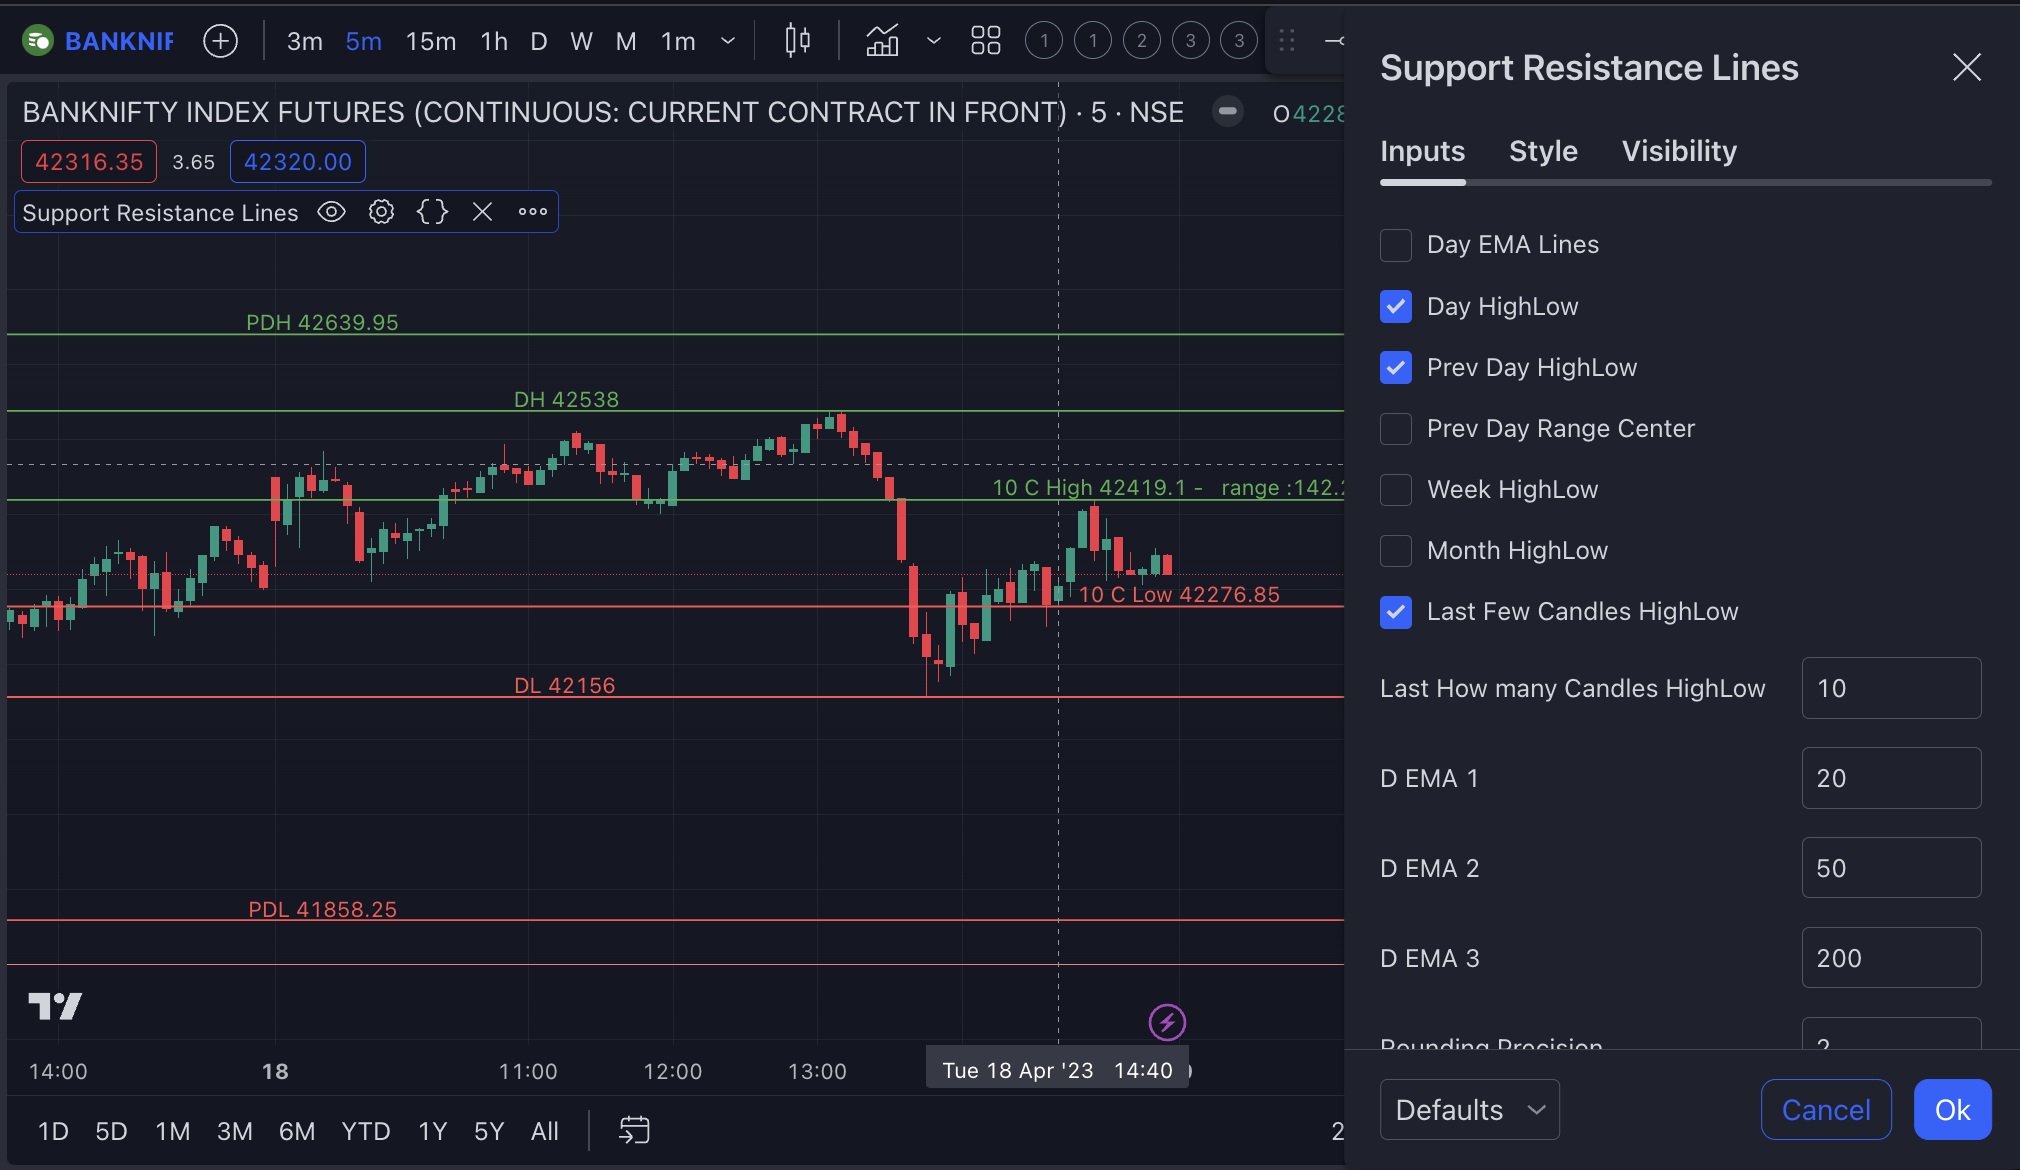
1. Automatic Support and Resistance Lines.
This script draws various support and resistance lines automatically. Following are supported :- Day's High and Low Lines (DH,DL)
- Prev Day's High and Low Lines ( PDH, PDL)
- Weekly High and Low lines
- Monthly High and Low Lines
- Horizontal lines at Day EMAs even if you are in lower timeframe (Default 20,50 and 200).
All lines are configurable, e.g. choose whichever you want to draw. EMA lines are calculated based on symbol's Day EMAs. Even if you are on lower timeframe, (5m or 15m or 1H), it will show 20, 50, 200 DEMA lines so you don't have to go to Day TF to get Day EMAs.
- Day's High and Low Lines (DH,DL)
- Prev Day's High and Low Lines ( PDH, PDL)
- Weekly High and Low lines
- Monthly High and Low Lines
- Horizontal lines at Day EMAs even if you are in lower timeframe (Default 20,50 and 200).
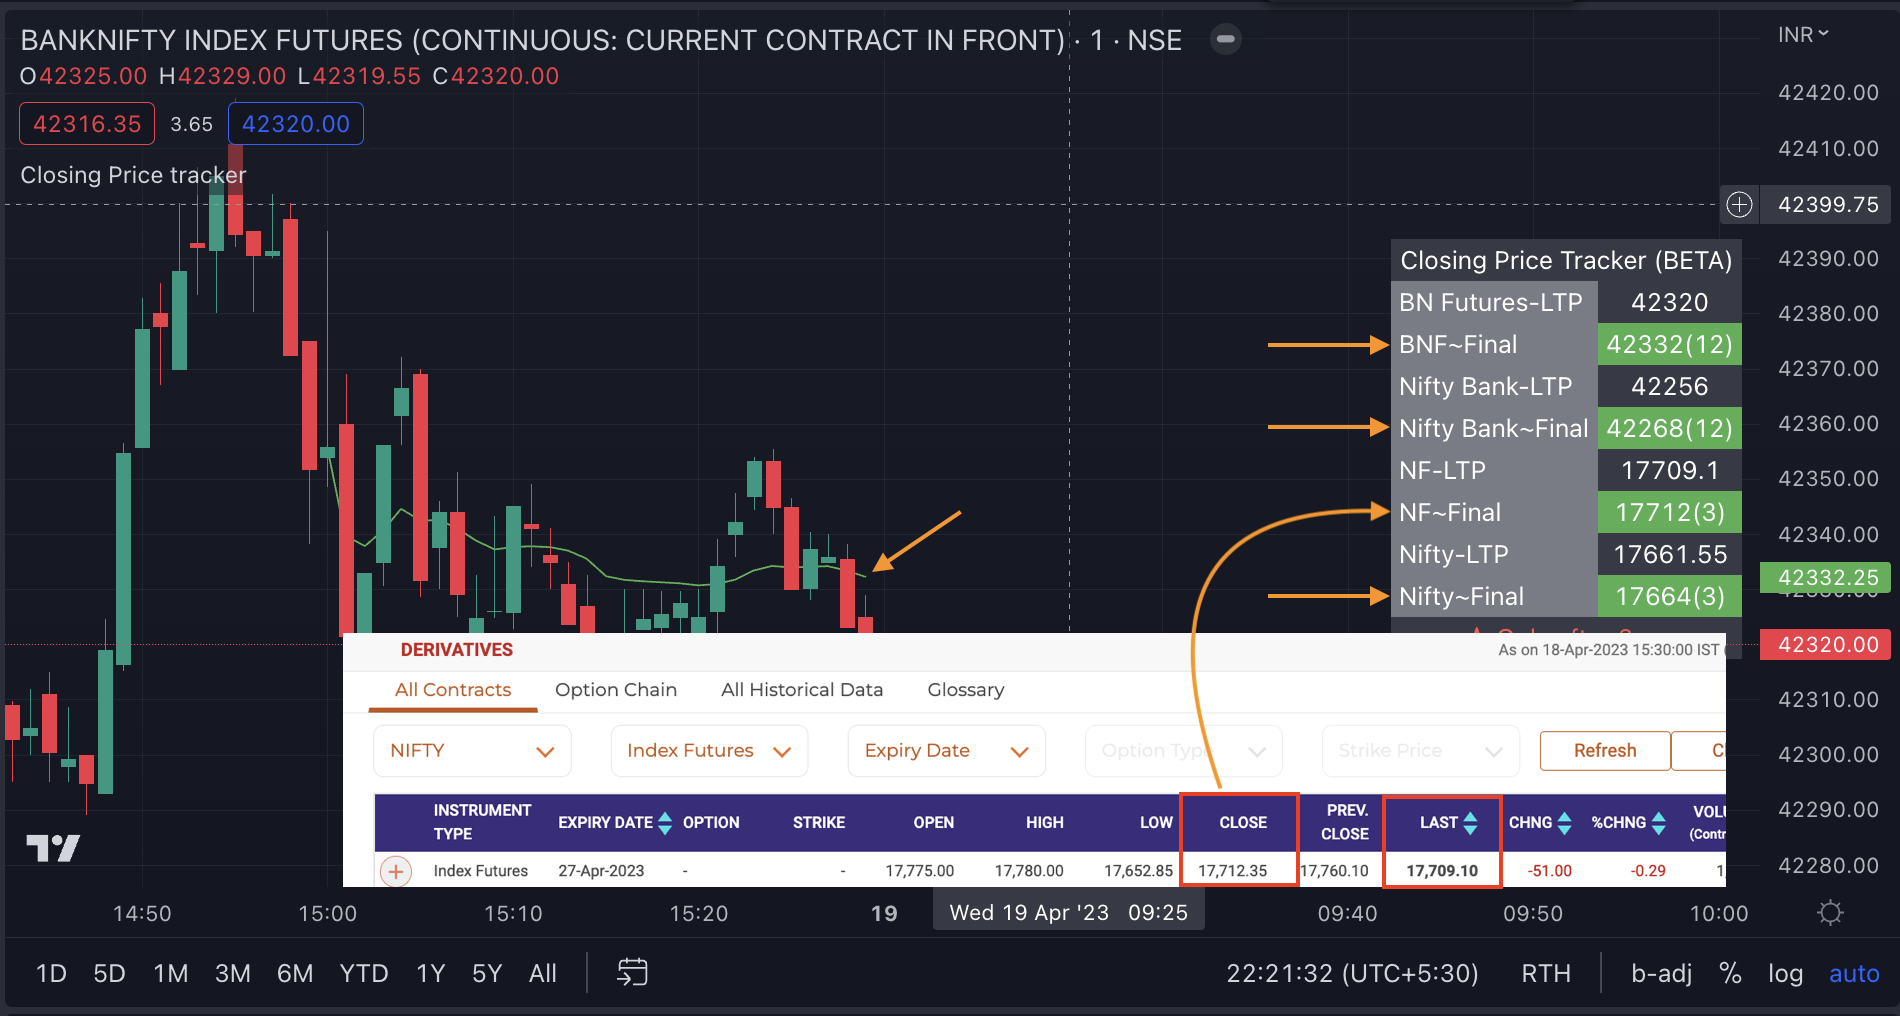
2. BankNifty Nifty Closing Settlement Price Tracker.
NSE's closing price is calculated as a weighted average of the last 30 minutes of trading. As a result, the closing price on the daily charts also does not match the LTP since it is updated using the NSE bhavcopy's closing price. Due to this behavior, in last 30 mins of trading, we see major moves but we don't know at what price final settlement will happen by looking at LTP on chart. This indicator helps in this case and in table, after 3pm on 1m chart, it starts showing final settlement price vs LTP. It also has option to draw this settlement price line on chart anchored at 3 pm. To make life easy, it will show BankNifty Futures, BankNifty spot, Nifty Futures and Nifty spot's final settlement price in one table.
Reason this price is required is that Option prices relies on this settlement prices while we might be just looking at LTP which is wrong price to calculate option price.
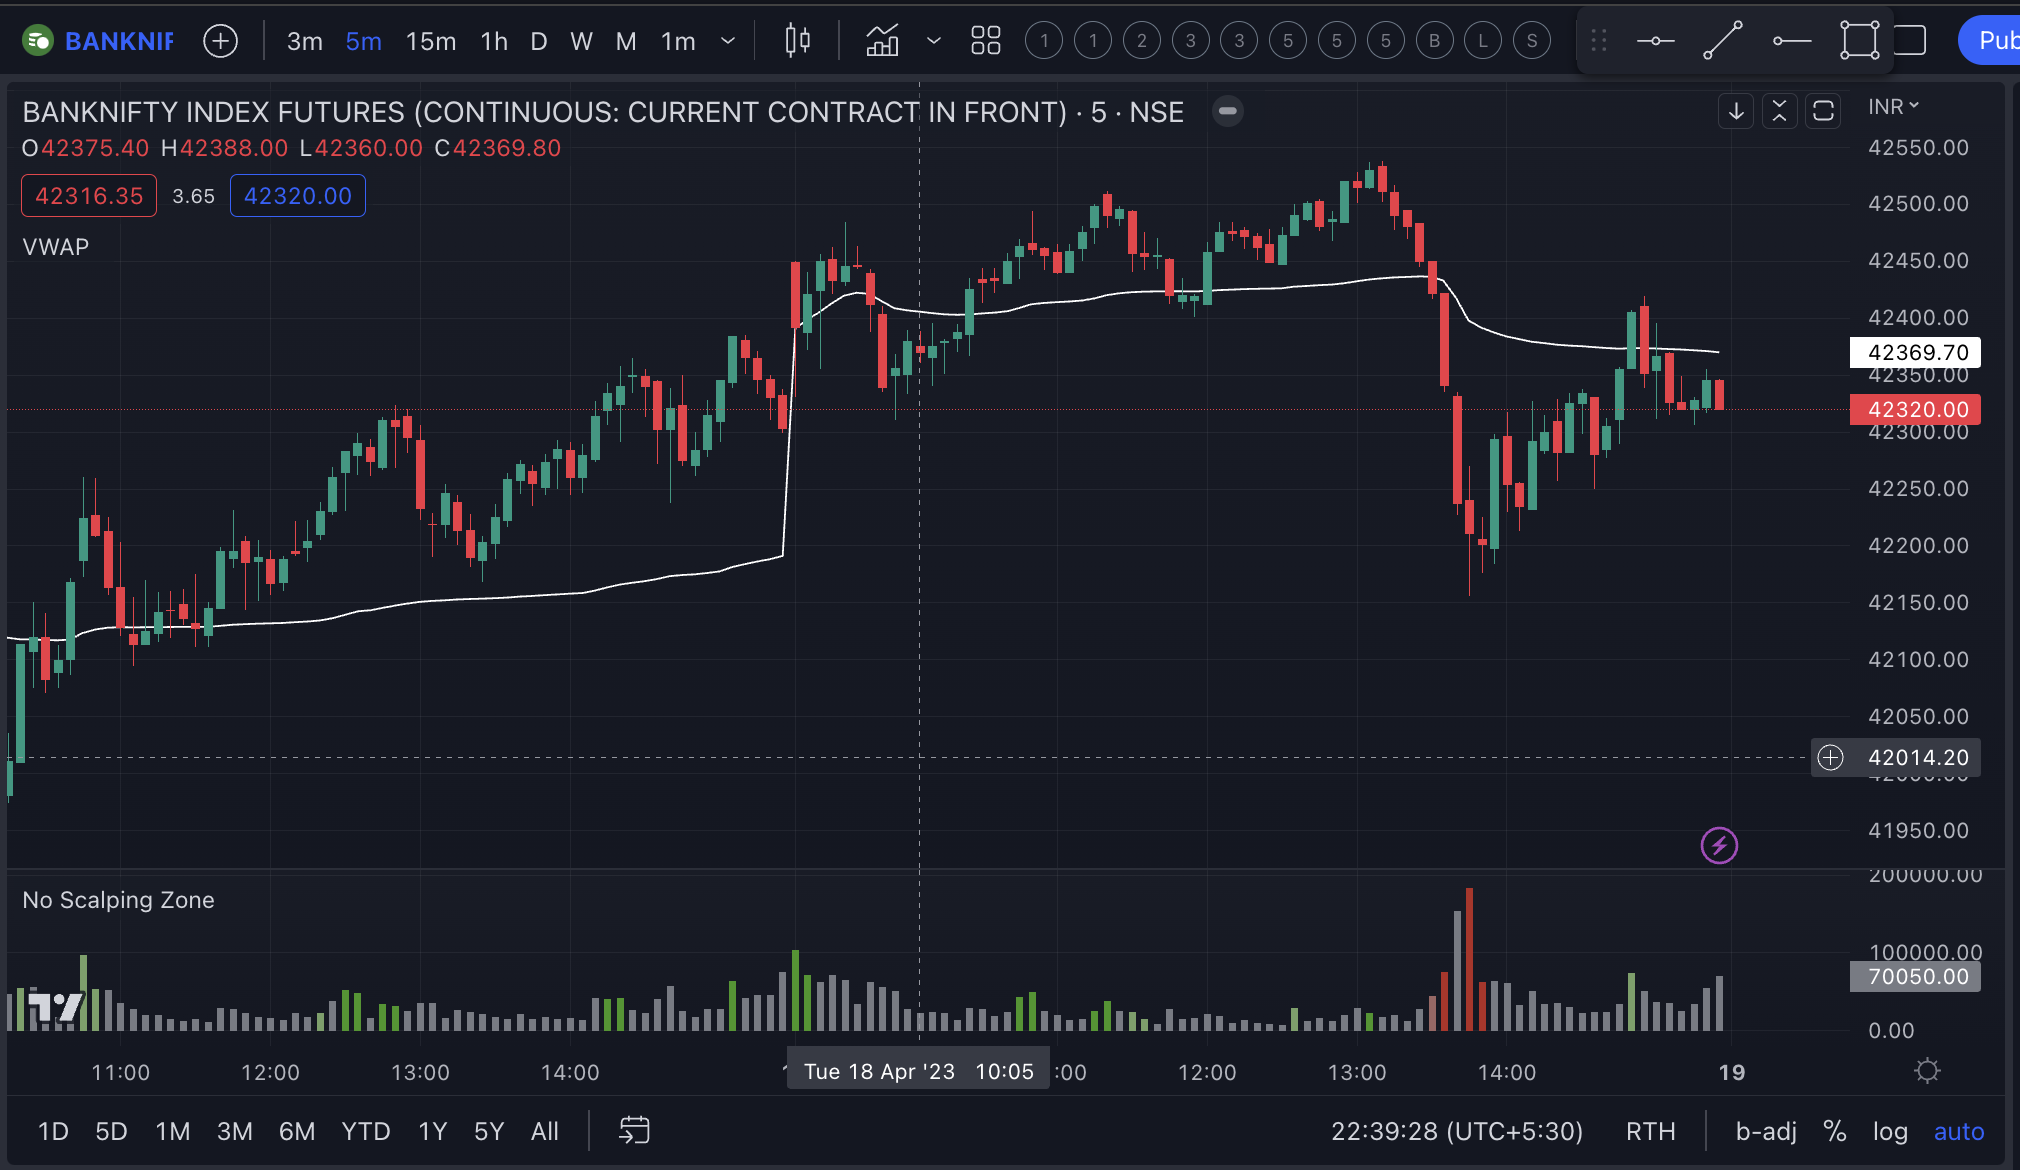
3. No Scalping Zone.
Time frame : 3 min
Charts : BankNifty futures or NIfty futures.
The script color codes volume bars in Light green, Green, Gray, Light red, and Dark red colors.
it is developed to work best with Nifty and Banknifty futures chart on 3 or. 5 min time frame.
How to use :- Gray bars to avoid scalping.
- Green / Light green for going long.
- Red / Light red for going short.
- It uses RSI, SuperTrend, VWAP, Previous One hour price range and first 15m candle price range to decide scalping zones.
- Use mainly Gray zones to "Avoid scalping trades".
- Gray bars to avoid scalping.
- Green / Light green for going long.
- Red / Light red for going short.
- It uses RSI, SuperTrend, VWAP, Previous One hour price range and first 15m candle price range to decide scalping zones.
- Use mainly Gray zones to "Avoid scalping trades".
Read more details in the script's description.
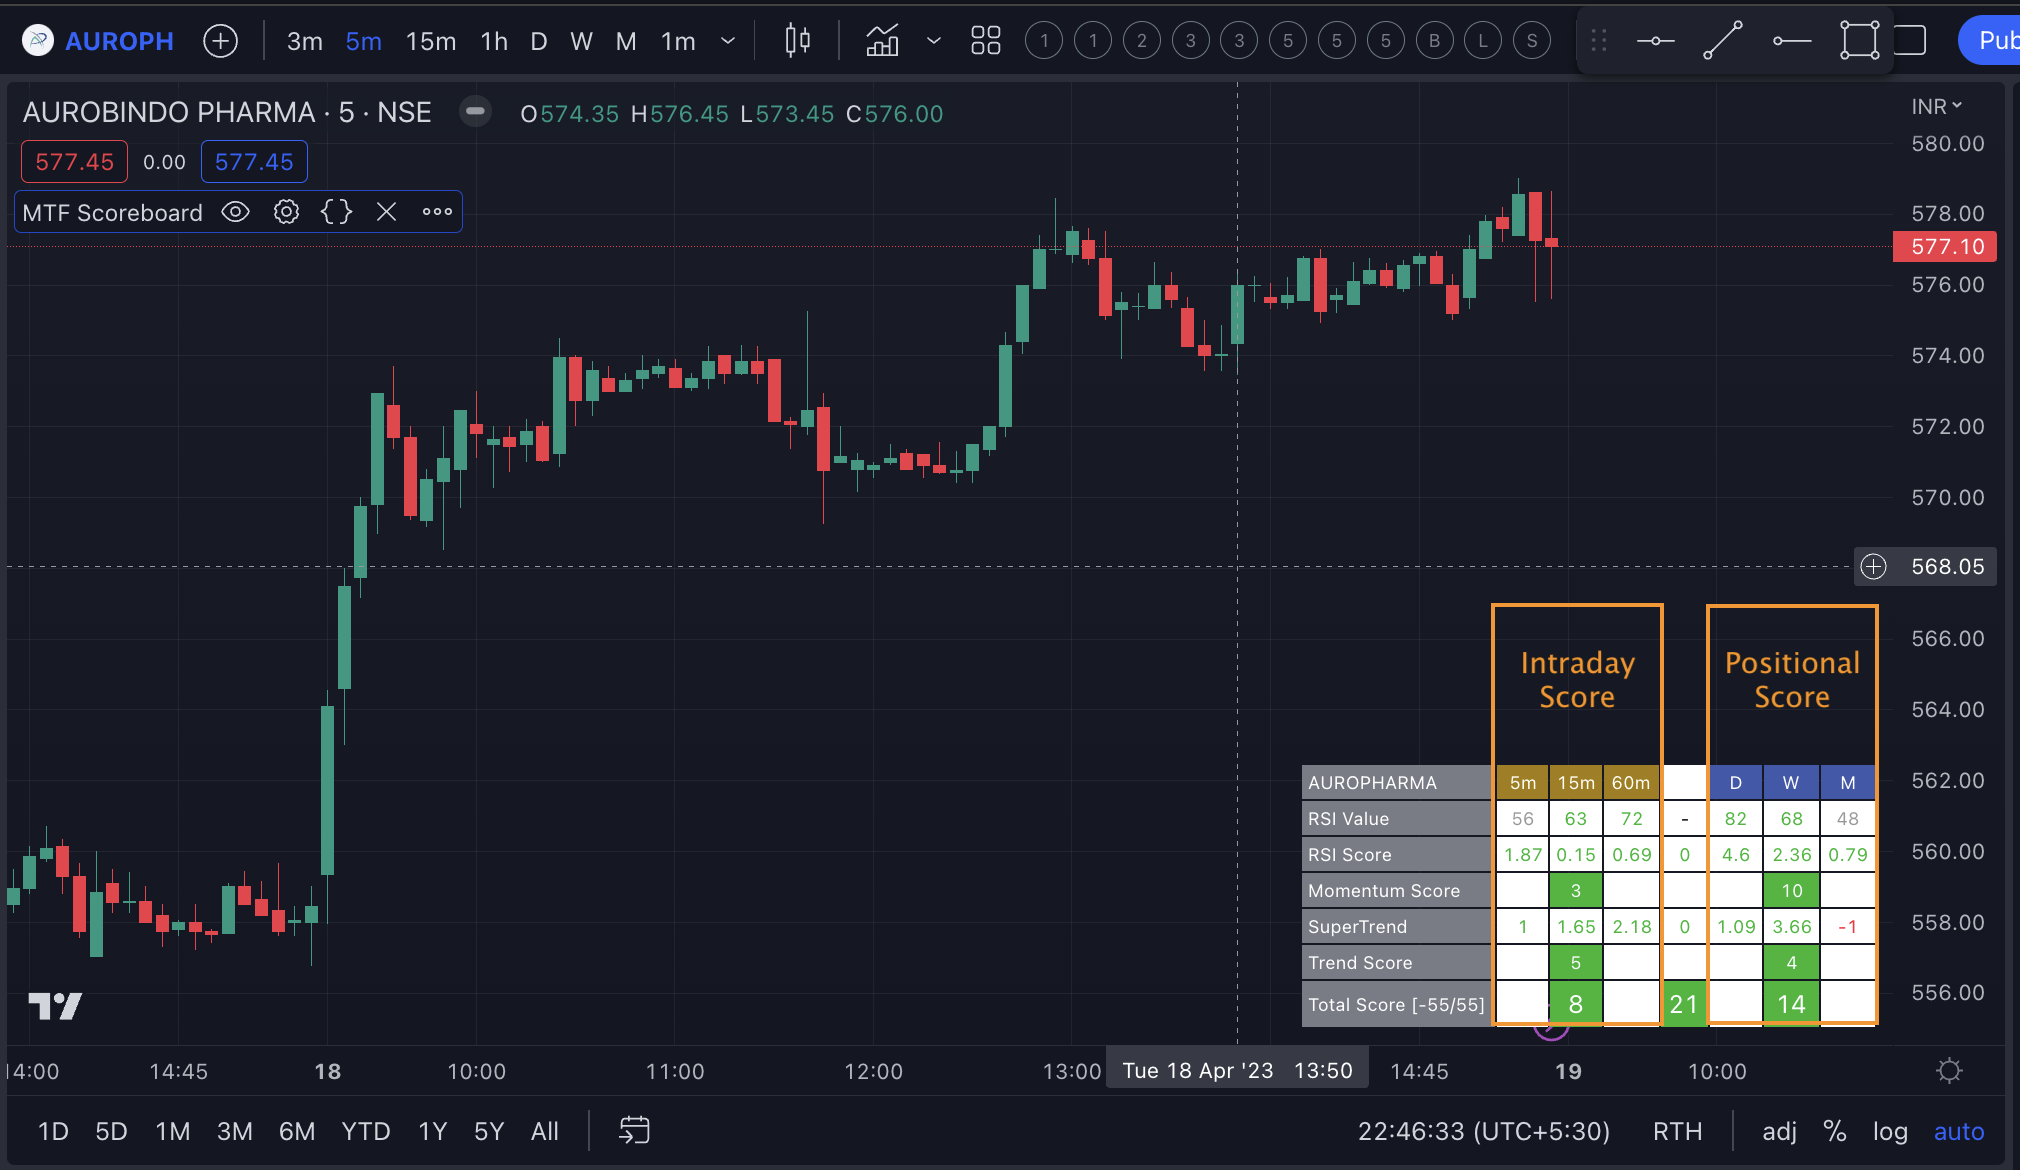
4. MTF Momentum Score for any stock.
It calculates MultTimeFrame momentum score for the stock with a scoring formula using RSI, RSI Change, Super Trend (Default 10,2 used) and ST Slope.For intraday, Score is calculated in 5m, 15m and 1H time frame and shown in left side of the table. For positional, Score is calculated in D, W and M time frame and shown to the right side of the table.
Read more details in the script's description.