Multi-TimeFrame
Momentum Analysis
AltraOne scores 500 NSE stocks, 500 S&P 500 stocks, and 60 TSX stocks daily using RSI, EMA placement, and crossovers across multiple timeframes. Find which sectors and stocks have the strongest momentum, absolutely FREE, no signup required.
What's New
- •New and Better Visual Theme
- •Sectoral Relative Strength Ranking
- •Stock Relative Strength Scores
- •Drill-Down Analytics
- •Canada / TSX Market Support
How to Use
Three steps checklist to trade or invest in the best momentum stocks.
STEP 01
Market
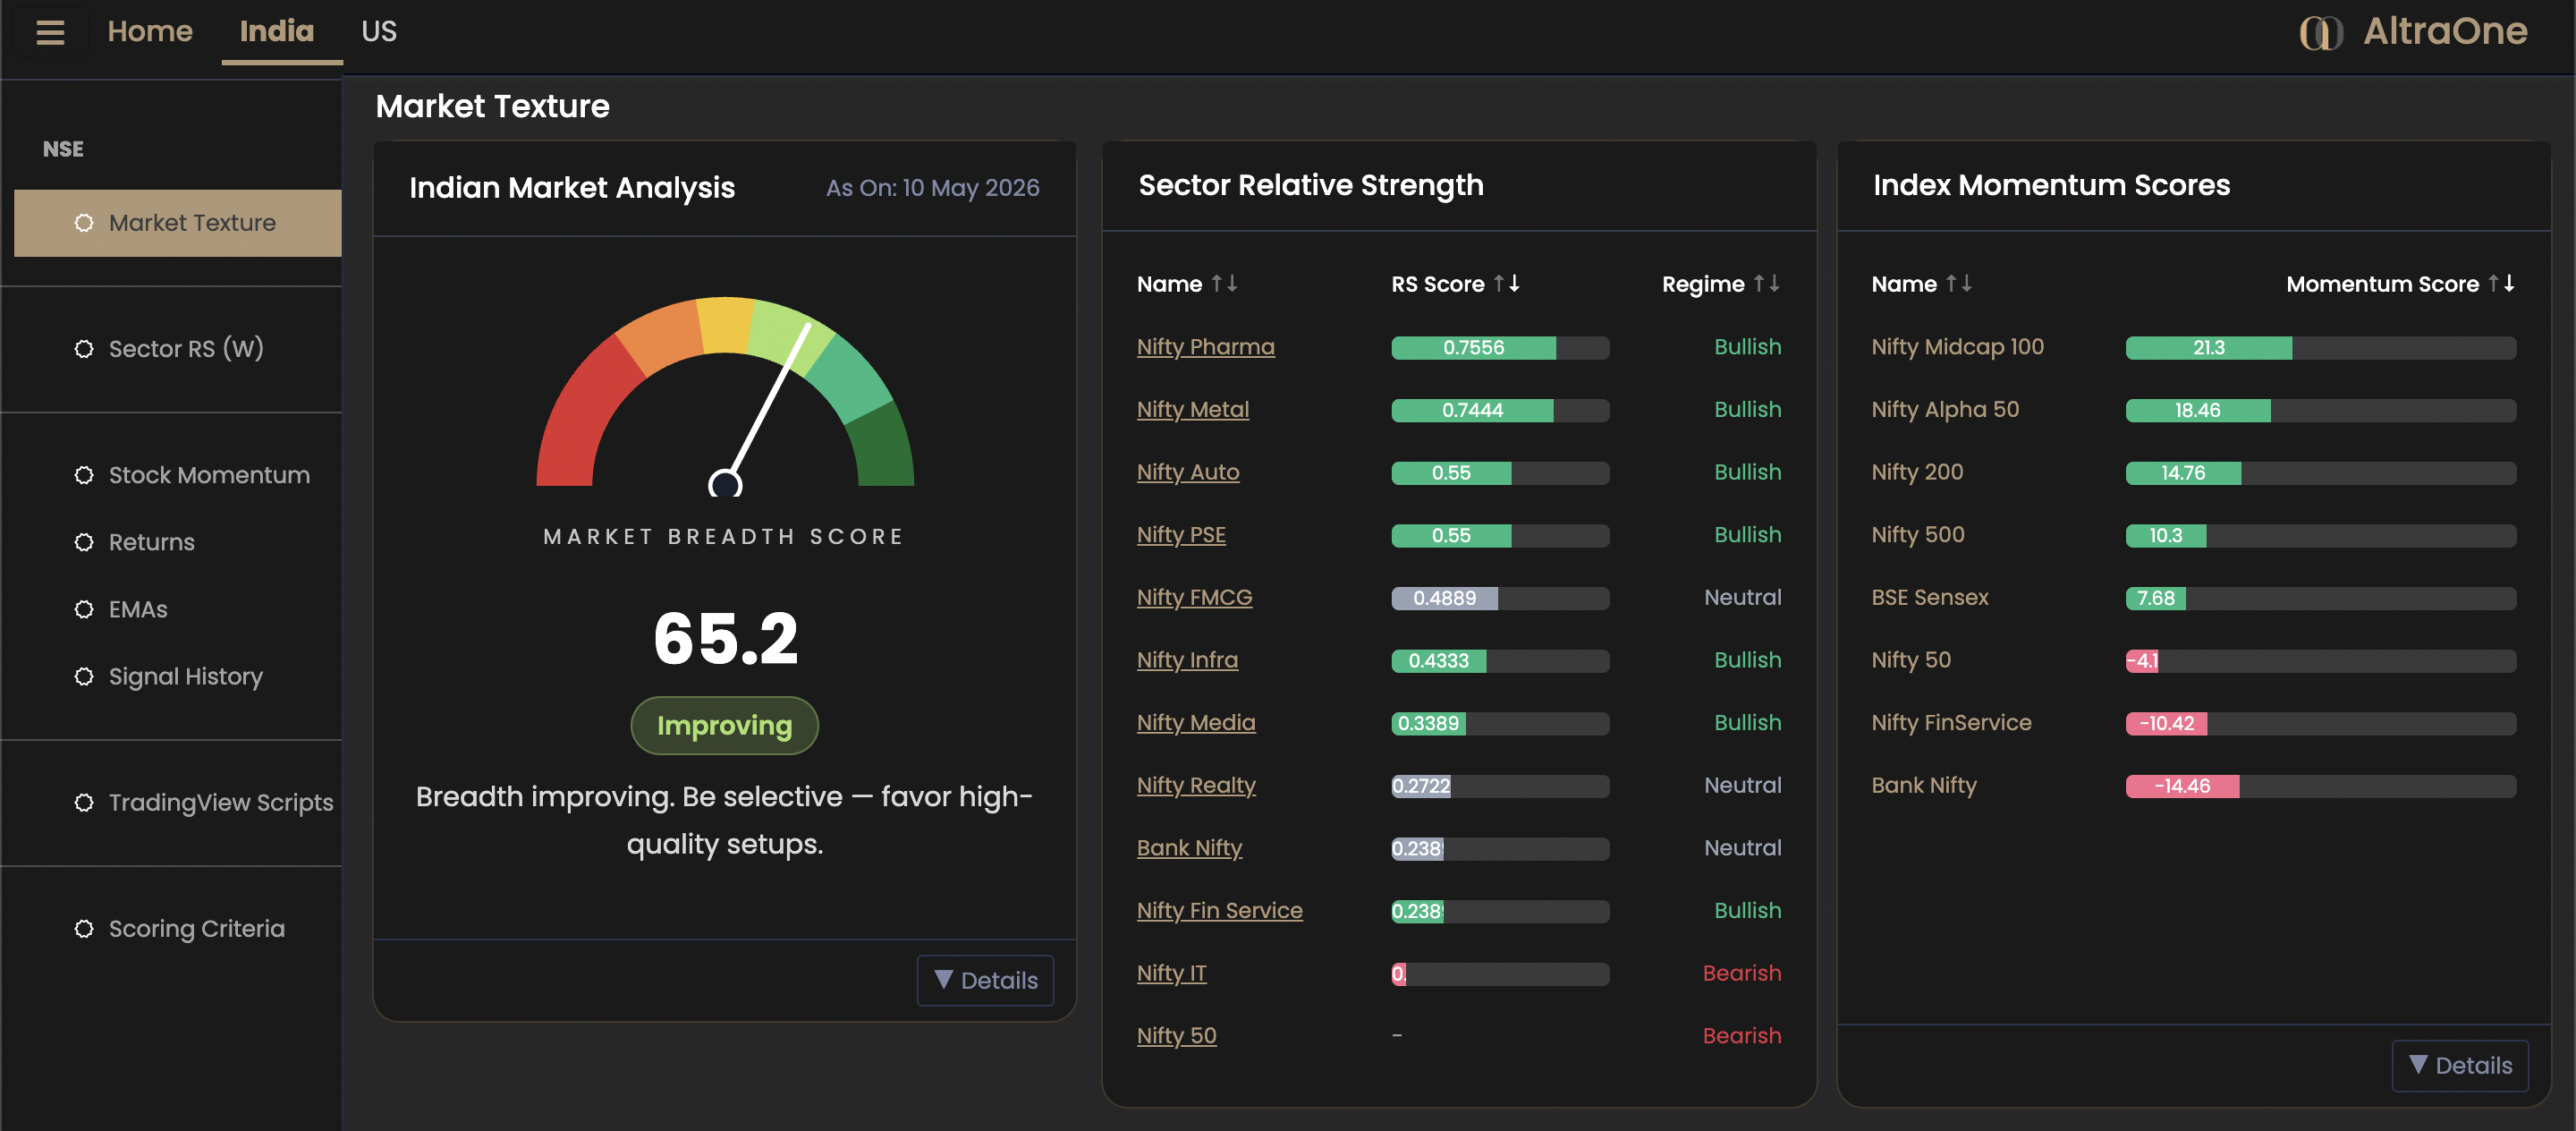
Is the market itself in momentum? Check the Market Texture view to see what % of stocks are above key EMAs, a quick read on whether momentum strategies are likely to perform well overall.
STEP 02
Sectors
Check the sectors with the higher Relative Strength Score and Bullish Regime - These are the sectors with the Relative Strength better than the benchmark. Ignore all other sectors.
STEP 03
Stocks
Lastly, check the stocks within the top-ranked sectors with the best Relative Strength Score with respect to the sector benchmark and highest Altra Score.
Everything you need for momentum trading
Focused views across India, US, and Canada markets, all driven by the same EOD data pipeline.
Market Texture
See what % of stocks from an Index are above each key EMA, a quick read on whether the broad market supports momentum trades.
OpenSector Ranking
Rank major sectors by Relative Strength Score, then drill down to see the top-ranked stocks within each sector.
OpenStock Ranking
Top NSE, S&P 500 and TSX stocks sorted by Altra Score. Higher score = more bullish momentum across daily, weekly, and monthly timeframes.
OpenFrequently Asked Questions
Everything you need to know before your first trade.
What is Altra Score?
Altra Score is a proprietary momentum score (0–100) that combines trend and momentum indicators (RSI, EMAs, crossovers) across the daily, weekly, and monthly timeframes into a single number. Higher score = more bullish momentum; lower score = more bearish.
It is calculated on an EOD (End of Day) basis, not intraday. Data is collected automatically every evening for the top 500 NSE stocks by market cap and 500 S&P 500 stocks.
What increases or decreases the Altra Score?
- RSI above 50 and rising
- Lower TF RSI crossing above higher TF RSI
- Price above 8, 20, 50, 200 DEMA
- 8/20 or 50/200 DEMA bullish crossover
- Each EMA sloping upward
- 8-Week and 30-Week EMAs aligned bullishly
- RSI below 50 and falling
- Lower TF RSI crossing below higher TF RSI
- Price below key DEMAs
- 8/20 or 50/200 DEMA bearish crossunder
- Each EMA sloping downward
- 8-Week and 30-Week EMAs aligned bearishly
Points to keep in mind
- Data is EOD, not live intraday. Covers top 500 NSE stocks by market cap, 500 S&P 500 stocks and 60 TSX stocks. Always check the last update date shown in the table header.
- Broker API data quality can vary; scores may occasionally reflect stale or missing data.
- Before entering a trade, wait for the same momentum to confirm in a lower timeframe (e.g. 8/20 DEMA crossover or RSI > 60 in 15m).
- Avoid counter-momentum trades: if a stock is in the top MTF bullish list, avoid shorting it.
- Check Market Texture first. When the majority of Nifty 50 stocks are below the 20 or 200 DEMA, momentum strategies tend to underperform.
How is Sector Relative Strength Scoring done?
- Sector RS is calculated as the ratio of the sector index price to the main market benchmark.
- For India (NSE): Sector Index / NIFTY 50
- For USA (S&P 500): Sector Index / S&P 500
- For Canada (TSX): Sector Index / TSX 60 (XIU)
- Then this RS Value is evaluated for relative scoring and ranking.
How is Stock Relative Strength Scoring done?
- Stock RS is calculated as the ratio of the stock price to its sector index.
- Formula: Stock Price / Sector Index
- Then this ratio is evaluated for relative strength scoring and ranking.
- This helps you find the best stocks within the best sectors, a two-level screening approach for momentum trading.
How do I use the Dashboard?
- Select a watchlist from the dropdown at the top of the Returns page.
- Stocks are sorted by Altra Score, highest (most bullish) at the top.
- Green cells = positive indicator; Red cells = negative indicator.
- Use the EMA filter buttons to narrow down to stocks with specific crossover signals (e.g. LTP above 8DEMA).
Ready to trade with the momentum?
Open the dashboard, pick a watchlist, and find today's top-scoring stocks in seconds.
Go to Dashboard →© Copyright 2026 AltraOne · Built for momentum traders