
Why Most Stock Scans Fail Before They Start
Here's a scenario most active traders recognise: you find a setup that looks perfect — clean breakout, strong chart, momentum building. You enter. Then the stock goes nowhere, or worse, reverses. Nothing was wrong with the stock's chart. What was wrong was the context it sat in.
The sector was quietly underperforming the market. Or the broader market itself had no real breadth behind it — just a few large caps holding up the index while everything else drifted. The setup looked right in isolation but was swimming against two layers of current.
This is the problem AltraOne's 3-step framework is designed to solve. Rather than starting with individual stocks and hoping the context cooperates, it starts with the market, then narrows to sectors, then selects stocks — in that order, every time.
This post walks through that framework with three real examples, one from each market AltraOne covers: Axis Bank on NSE, Applied Materials (AMAT) on S&P 500, and Royal Bank of Canada (RY) on TSX. All data is from 26 June 2026.
The Framework at a Glance
Before the walkthrough, here's the structure:
Step 1 — Market Texture: Is the overall market healthy enough to support long positions? If not, reduce exposure regardless of what individual stocks or sectors look like.
Step 2 — Sector Relative Strength: Which sectors are outperforming the benchmark right now? Only stocks from leading sectors qualify. Lagging sectors are filtered out entirely. (For a deeper explanation of how sector RS ranking — what AltraOne calls the Altra Sector Score — works across all three markets, see Sector Relative Strength Ranking: The Foundation of Momentum Stock Picking.)
Step 3 — Altra Score: Within the leading sectors, which individual stocks show the strongest momentum across daily, weekly, and monthly timeframes? The highest-ranked stocks in the highest-ranked sectors are the primary targets.
Each step is a filter. By the time you reach a stock, it has passed three layers of validation.
Example 1: Axis Bank (NSE)
Step 1 — Check the Indian Market
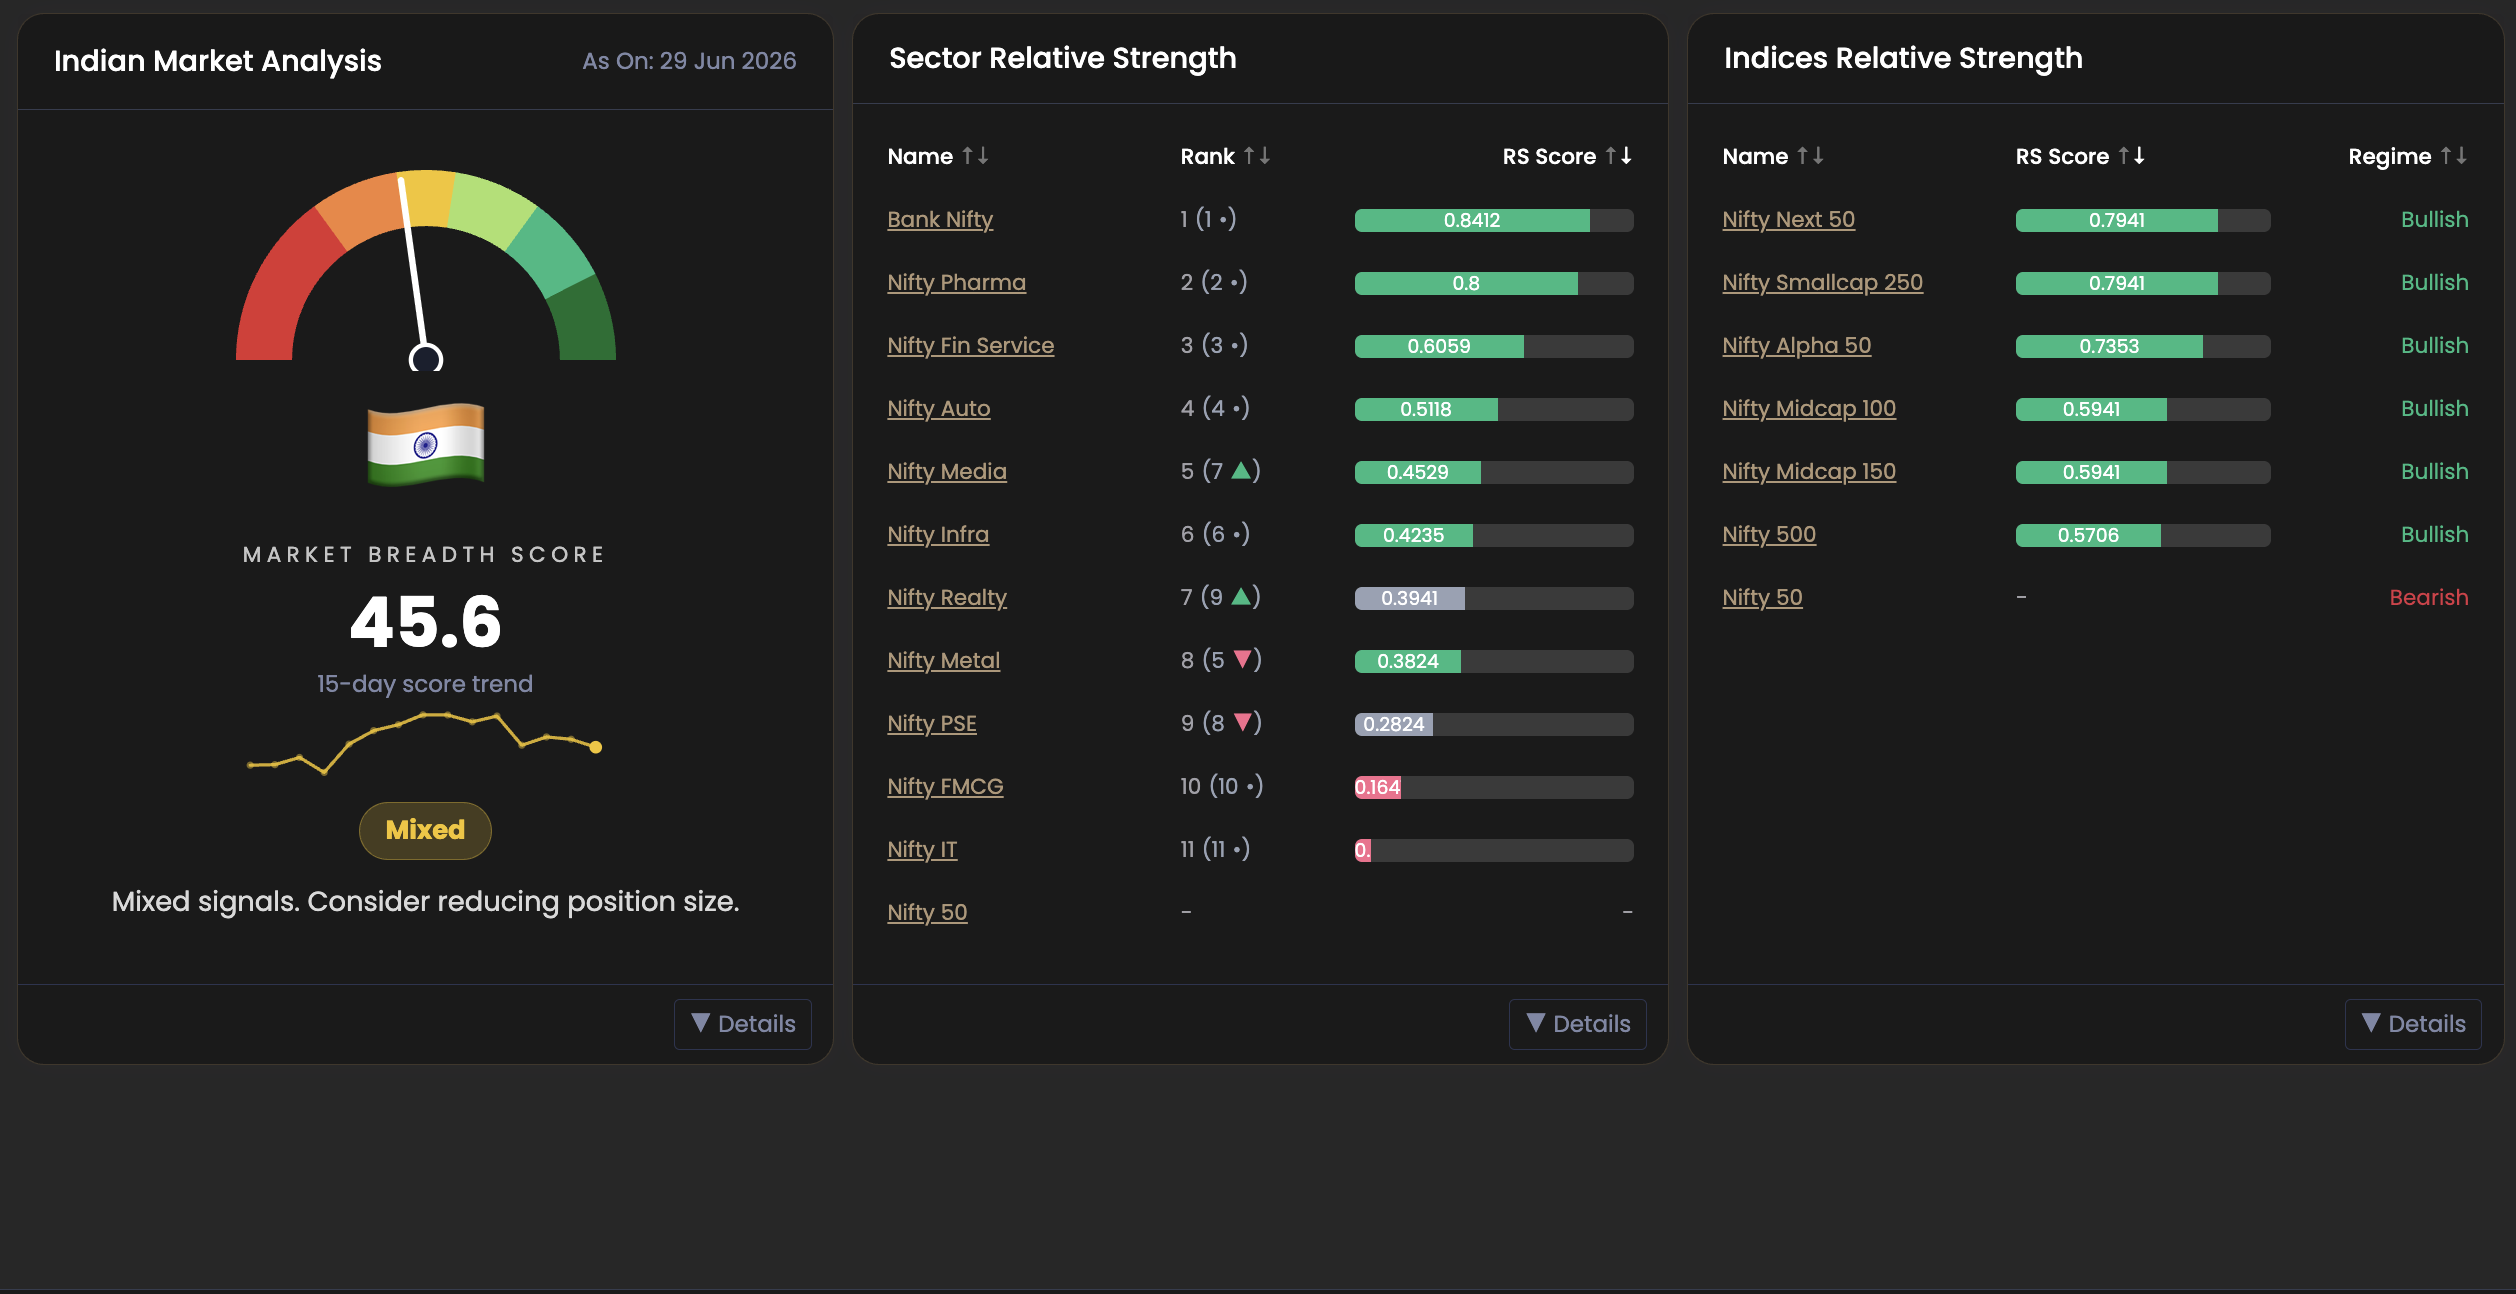 AltraOne's India market page as of 29 Jun 2026 — breadth score 45.6, Mixed regime
The India market page shows a breadth score of 45.6, classified as Mixed. The 15-day trend line is flat to slightly declining. The platform's guidance is direct: "Mixed signals. Consider reducing position size."
This is a meaningful data point before a single sector or stock is looked at. A Mixed regime doesn't mean no trades — it means be selective, size conservatively, and only take the highest-conviction setups. This rules out speculative or marginal positions immediately.
The sector RS summary on the same page shows the divergence clearly: Bank Nifty is ranked #1 with an RS score of 0.84, Pharma is #2, and Nifty IT sits at the very bottom — #11 — with an RS score near zero. This tells us which direction to look in before opening any sector page.
Step 2 — Enter the Leading Sector
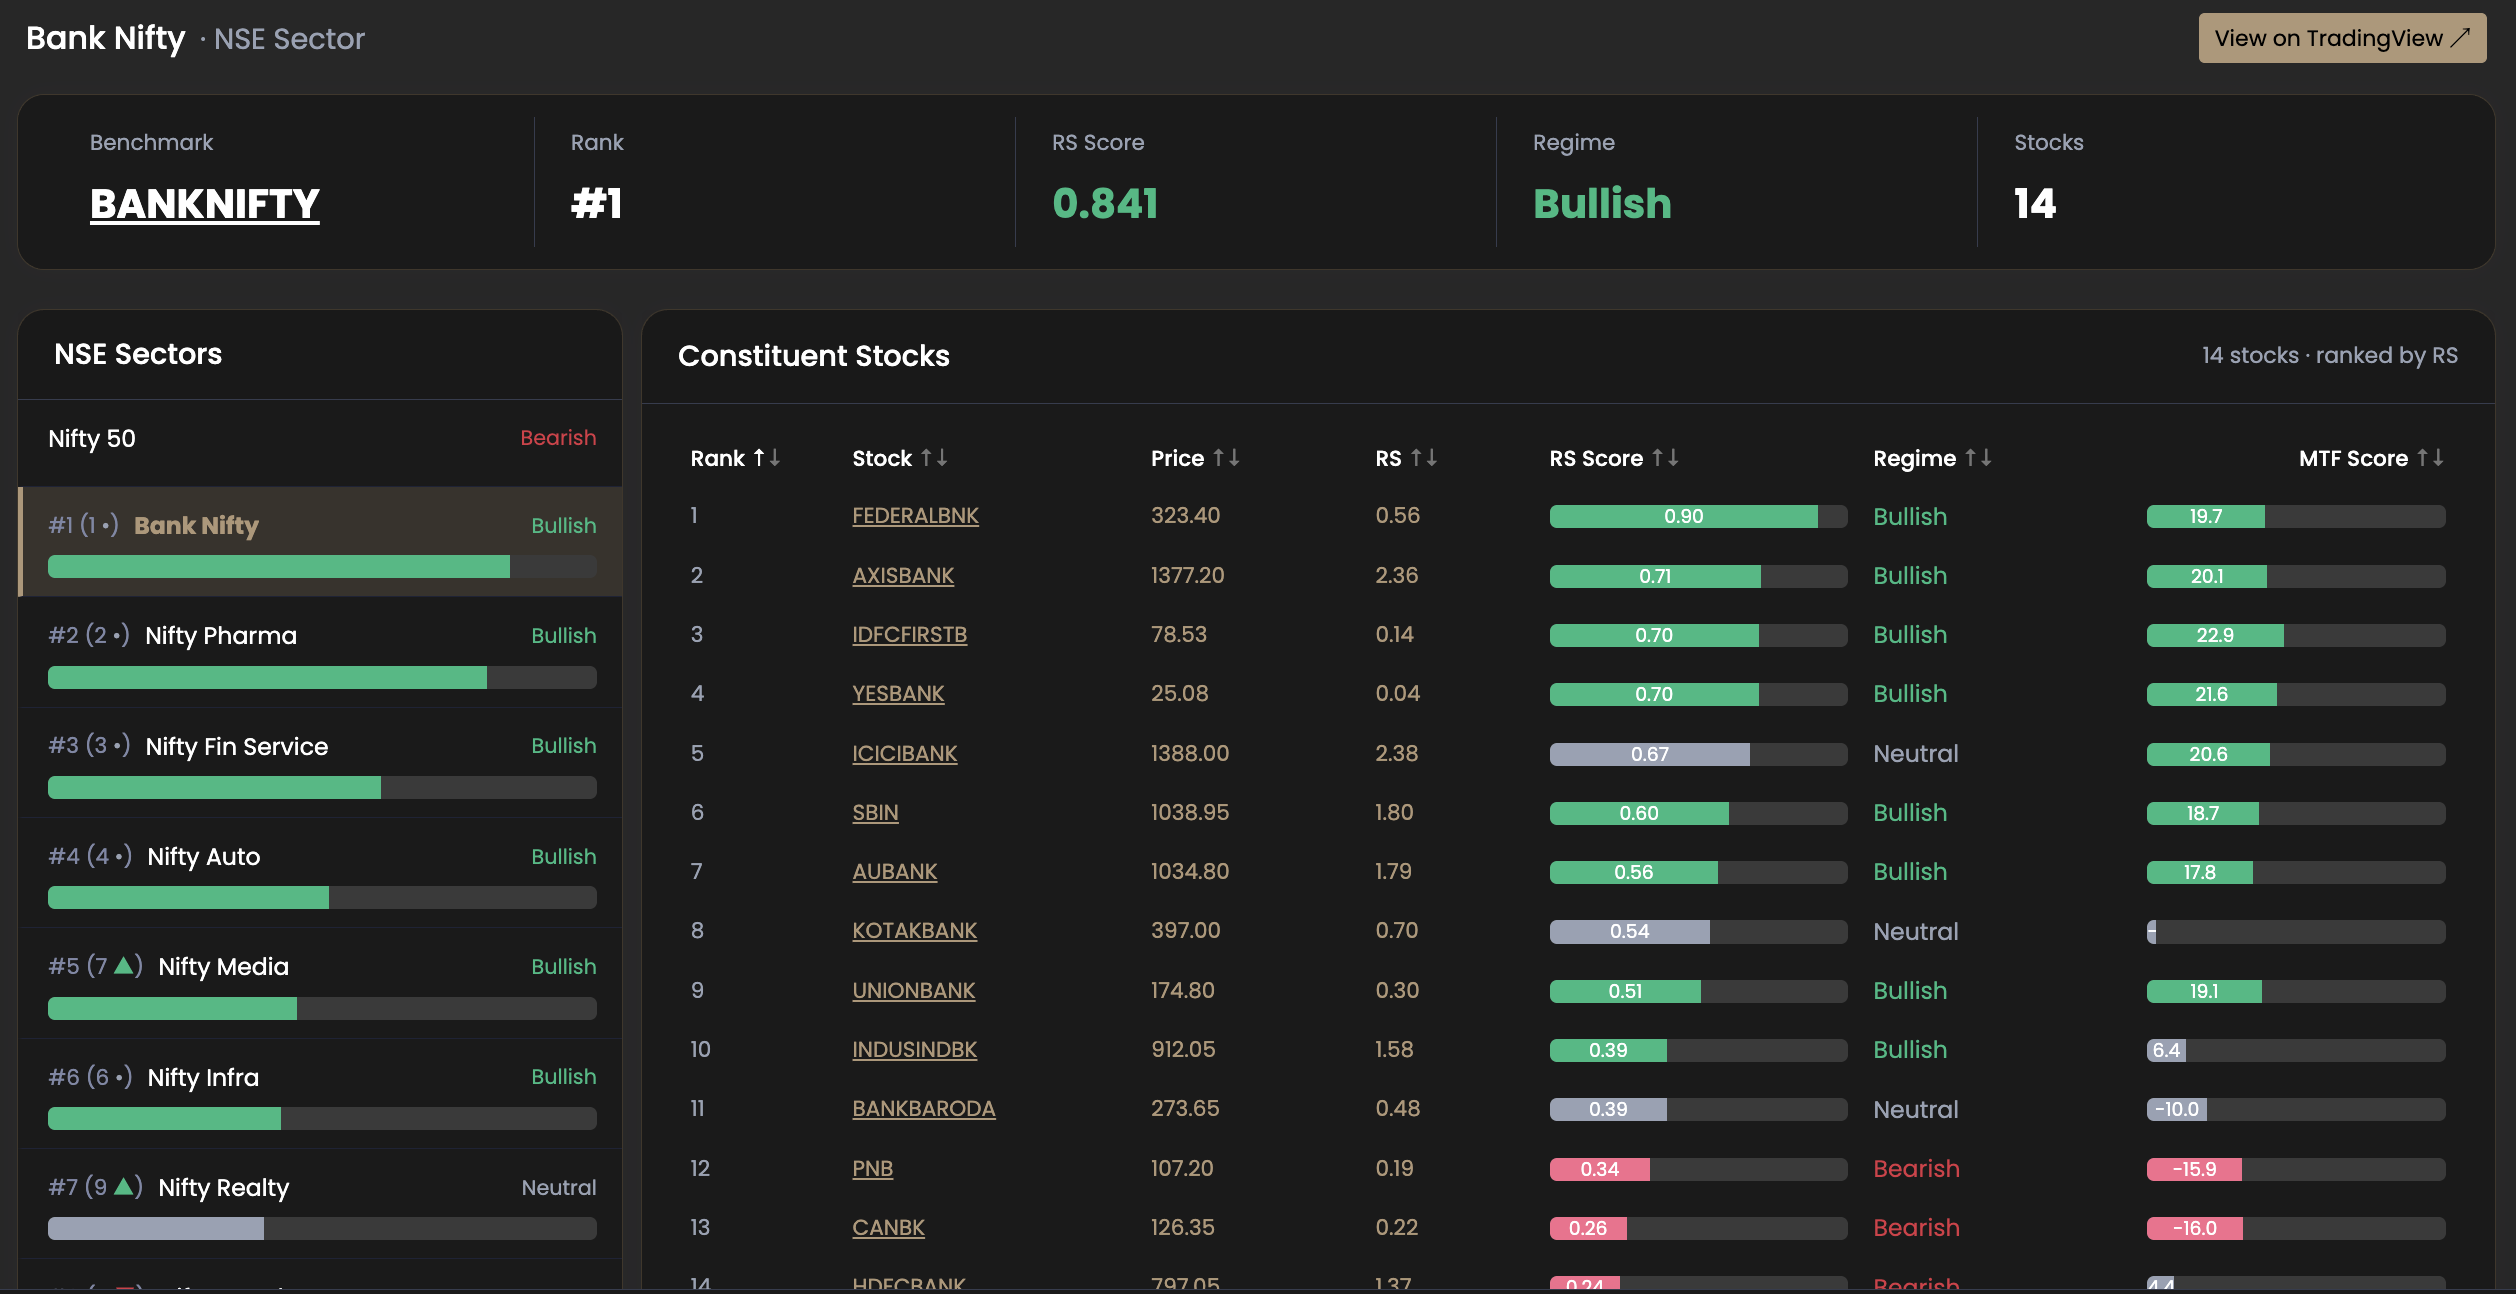 Bank Nifty sector page: Rank #1 across NSE, RS score 0.841, Bullish regime, 14 constituent stocks ranked by RS
Opening the Bank Nifty sector page confirms what the market overview signalled. (For a detailed breakdown of how NSE sector RS rankings work and which macro drivers move them, see NSE Sector Relative Strength Ranking.) Bank Nifty holds the #1 sector rank with an RS score of 0.841 against the BANKNIFTY benchmark, and its regime is classified as Bullish. The sector contains 14 stocks, all ranked by their individual RS within the sector.
The constituent stock table is the key output here. It shows rank, price, RS value, RS score, regime, and Altra Score for every stock in the sector. Axis Bank appears at Rank 2 with an RS score of 0.71 and a Bullish regime. This tells us Axis Bank is one of the top performers within the top-ranked sector on NSE. The filter is working.
Step 3 — Evaluate the Stock
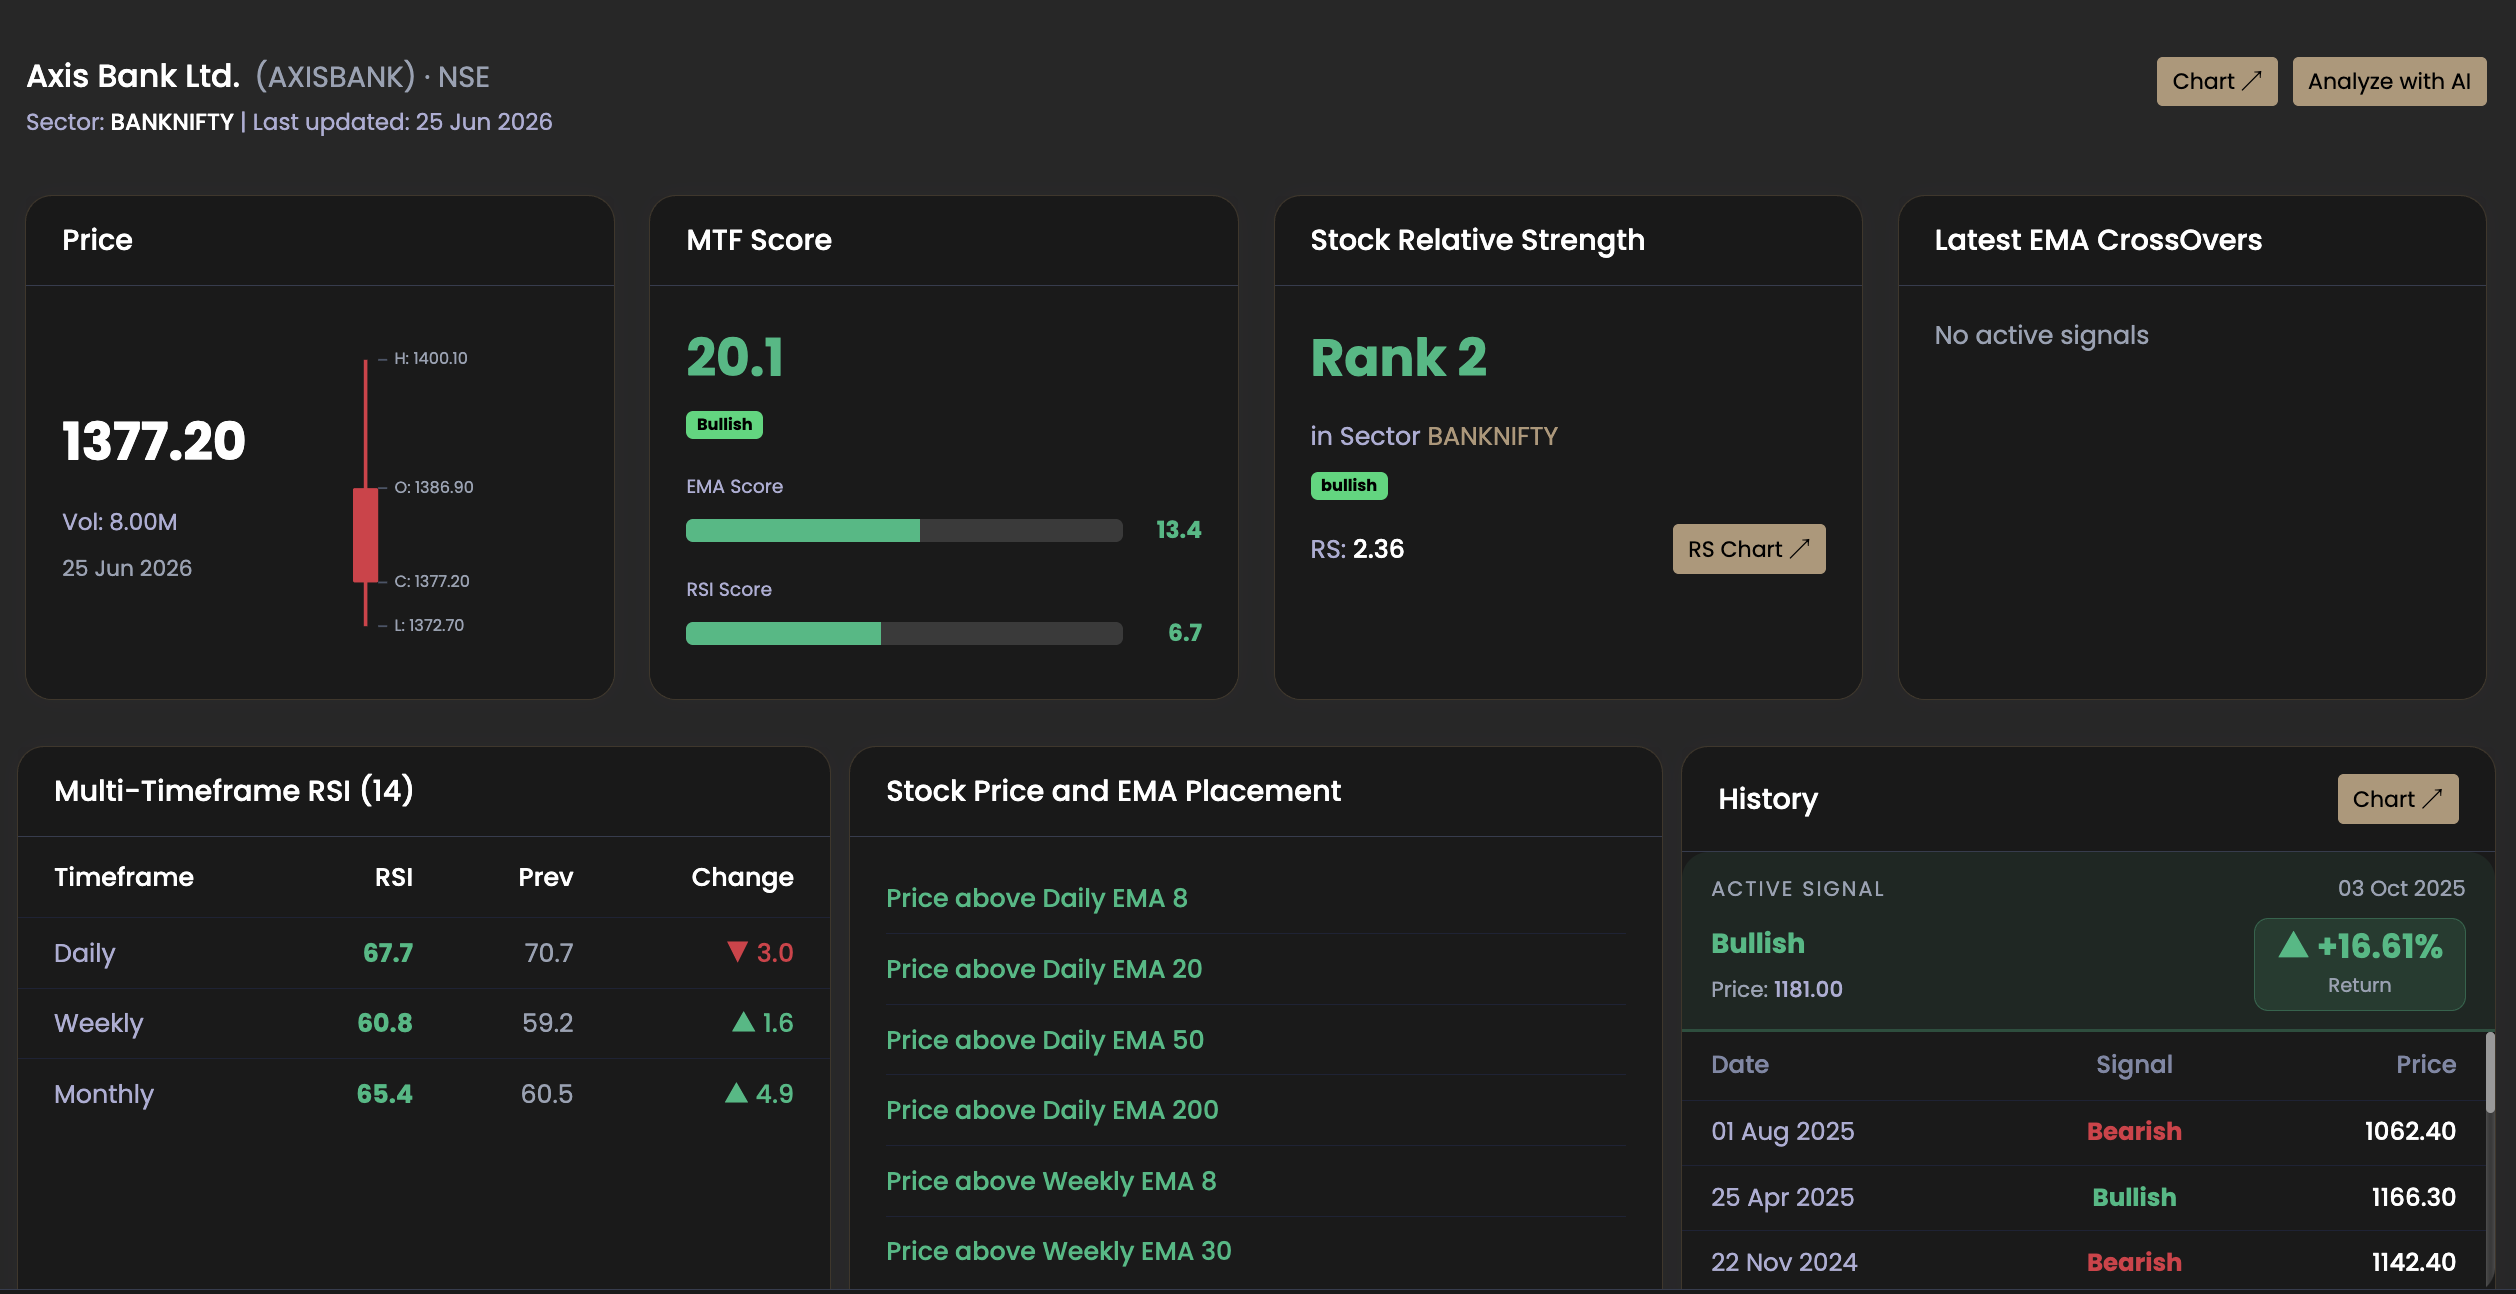 Axis Bank stock page: Altra Score 20.1, Bullish across all timeframes, RSI rising on weekly and monthly
The Axis Bank stock page pulls together the full momentum picture. The Altra Score is 20.1, firmly in Bullish territory (anything above 15 qualifies). The score is built from an EMA Score of 13.4 and RSI Score of 6.7 — both positive.
The multi-timeframe RSI table adds depth: Daily RSI is 67.7, Weekly is 60.8 (up 1.6 from prior), Monthly is 65.4 (up 4.9). All three are rising or holding — no timeframe is showing divergence. The EMA placement panel confirms price is above all key daily and weekly EMAs.
Stock Relative Strength shows Rank 2 in the BANKNIFTY sector with an RS value of 2.36 — the second-strongest name in the sector against its benchmark.
The signal history in the bottom right provides context: a Bullish EMA crossover signal triggered in October 2025 at ₹1,181. The current price is ₹1,377.20 — a return of +16.61% since the signal. The position is active and confirmed across all three steps of the framework.
Verdict for Axis Bank: Market is Mixed (caution warranted, reduce size) → Sector is Bullish (#1 on NSE) → Stock is Bullish (Altra Score 20.1, Rank 2 in sector). Three-layer alignment with a caveat on market breadth. A valid setup for a swing trader, sized conservatively given the mixed market environment.
Example 2: Applied Materials / AMAT (S&P 500)
Step 1 — Check the US Market
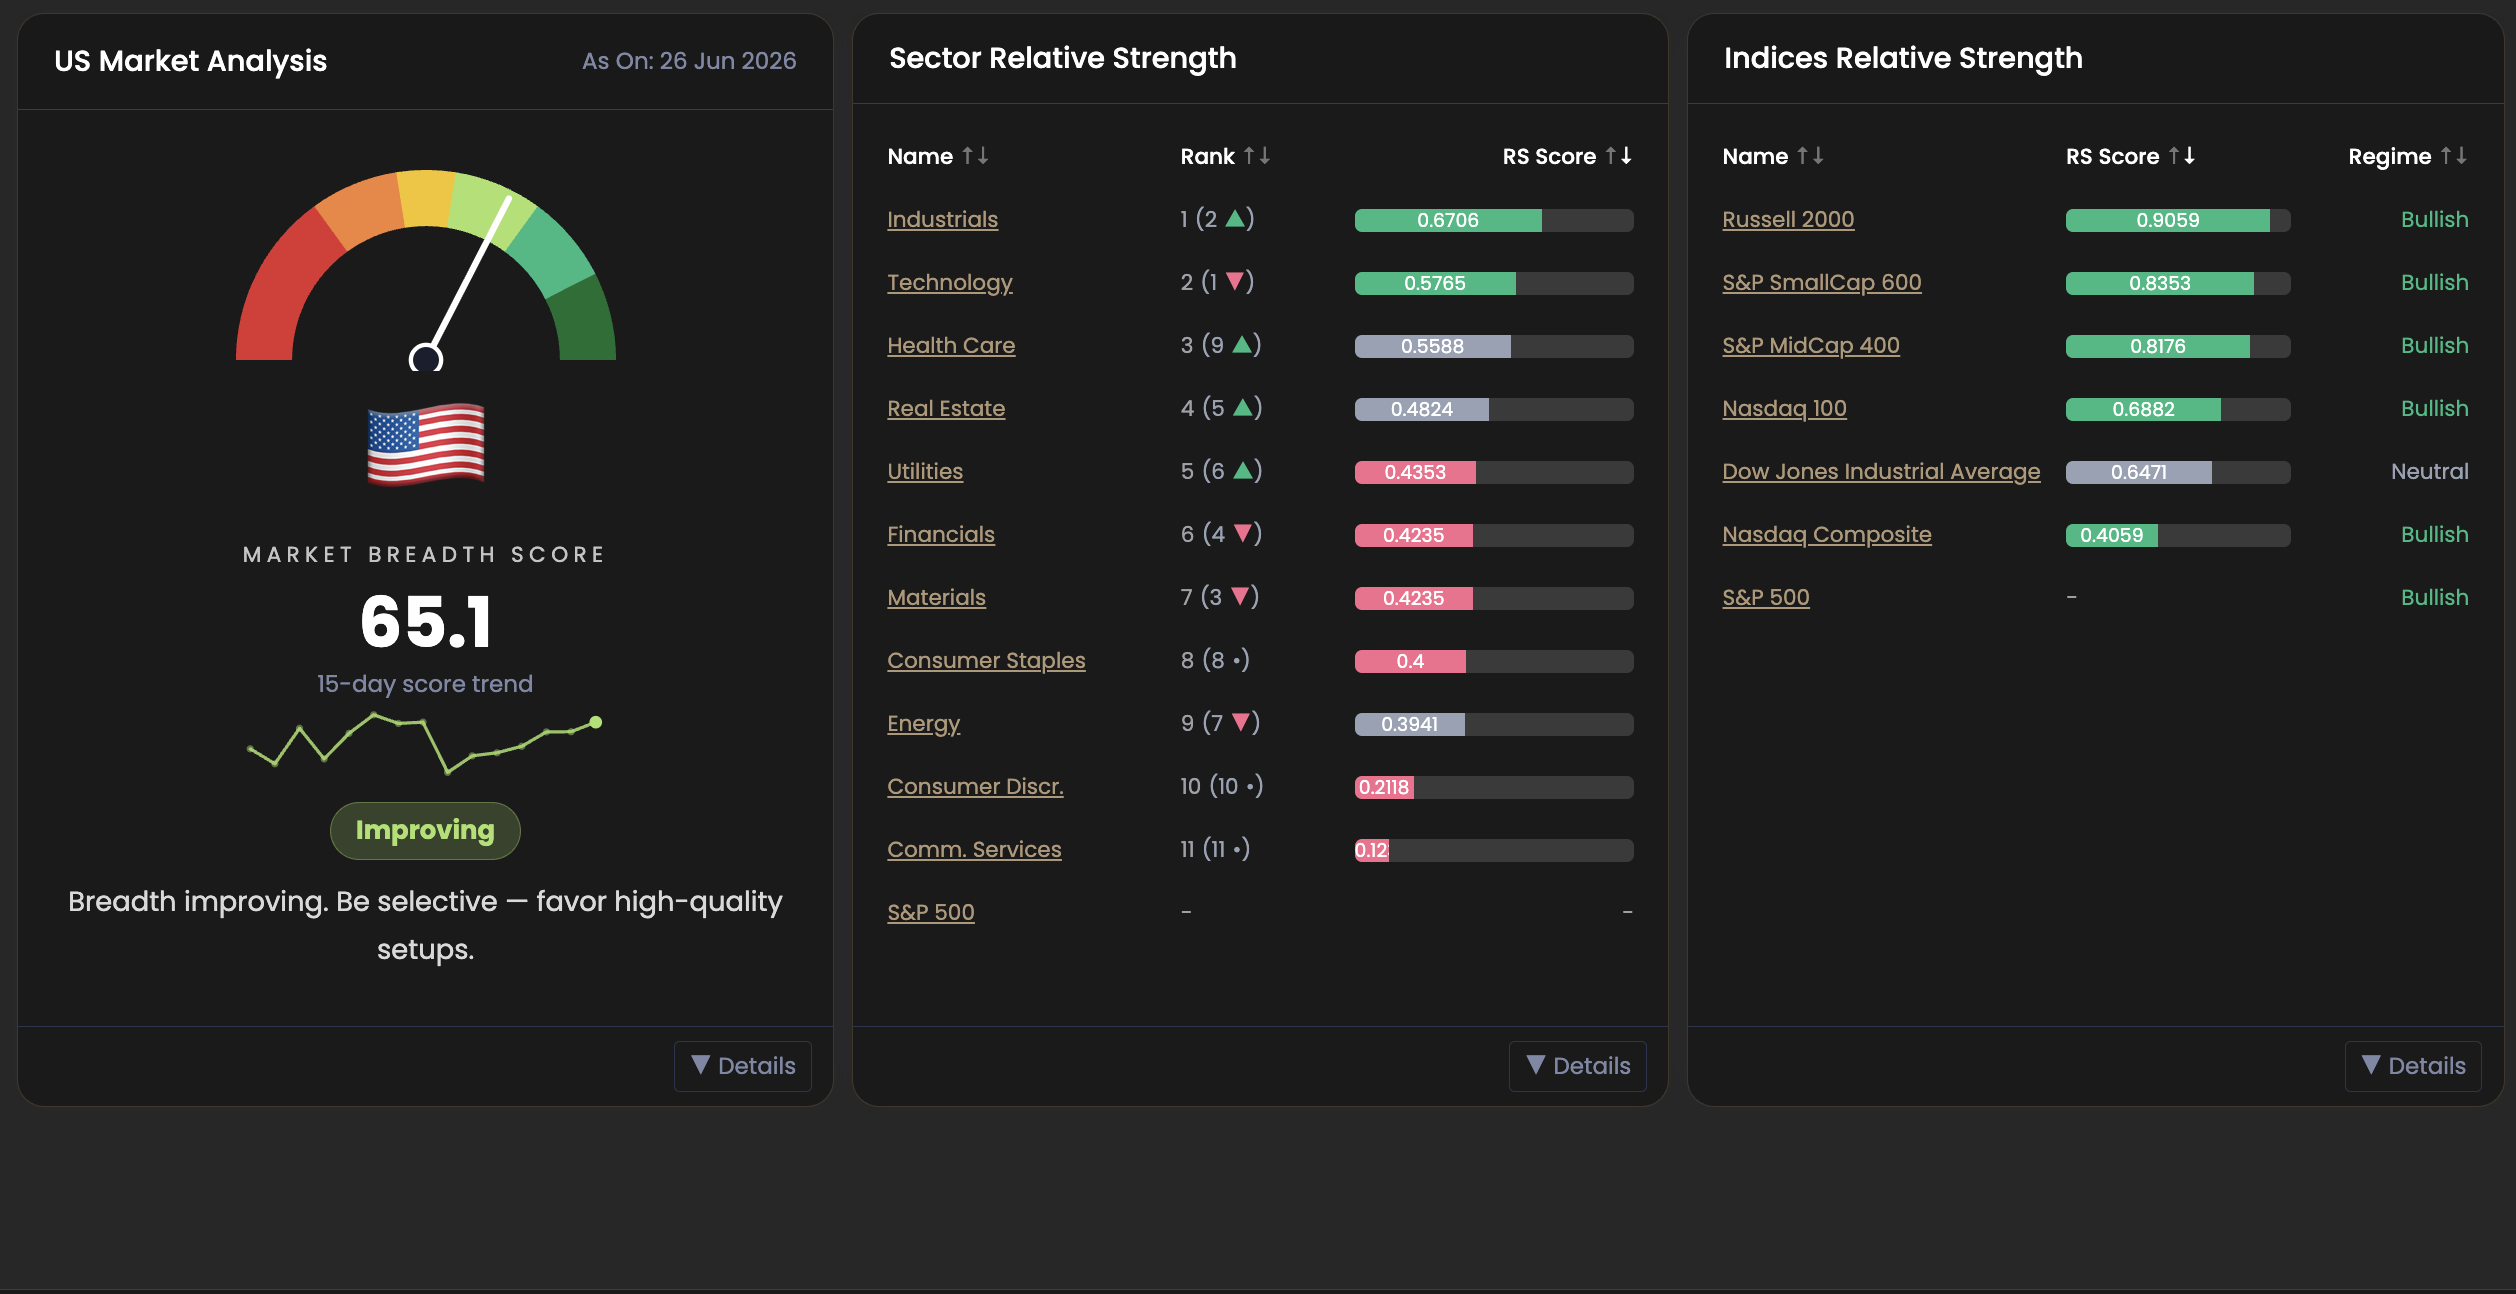 AltraOne's US market page as of 26 Jun 2026 — breadth score 65.1, Bullish regime, breadth improving
The US market is in a materially different position. Market breadth sits at 65.1 — above the 60 threshold that signals a healthy, broadly participating bull market. The 15-day trend is rising and the label is Improving. The guidance: "Breadth improving. Be selective — favour high-quality setups."
This is a better environment than India's Mixed reading. More stocks are participating, which provides a broader tailwind for individual setups.
The sector RS summary on the market page shows Industrials at #1 (RS 0.67) and Technology at #2 (RS 0.58), both in Bullish regimes. Lower in the ranking, Financials, Materials, Consumer Discretionary, and Communication Services are all showing red — Bearish or weakening RS. The split is stark, and it immediately directs attention toward the top two sectors.
Step 2 — Enter the Leading Sector
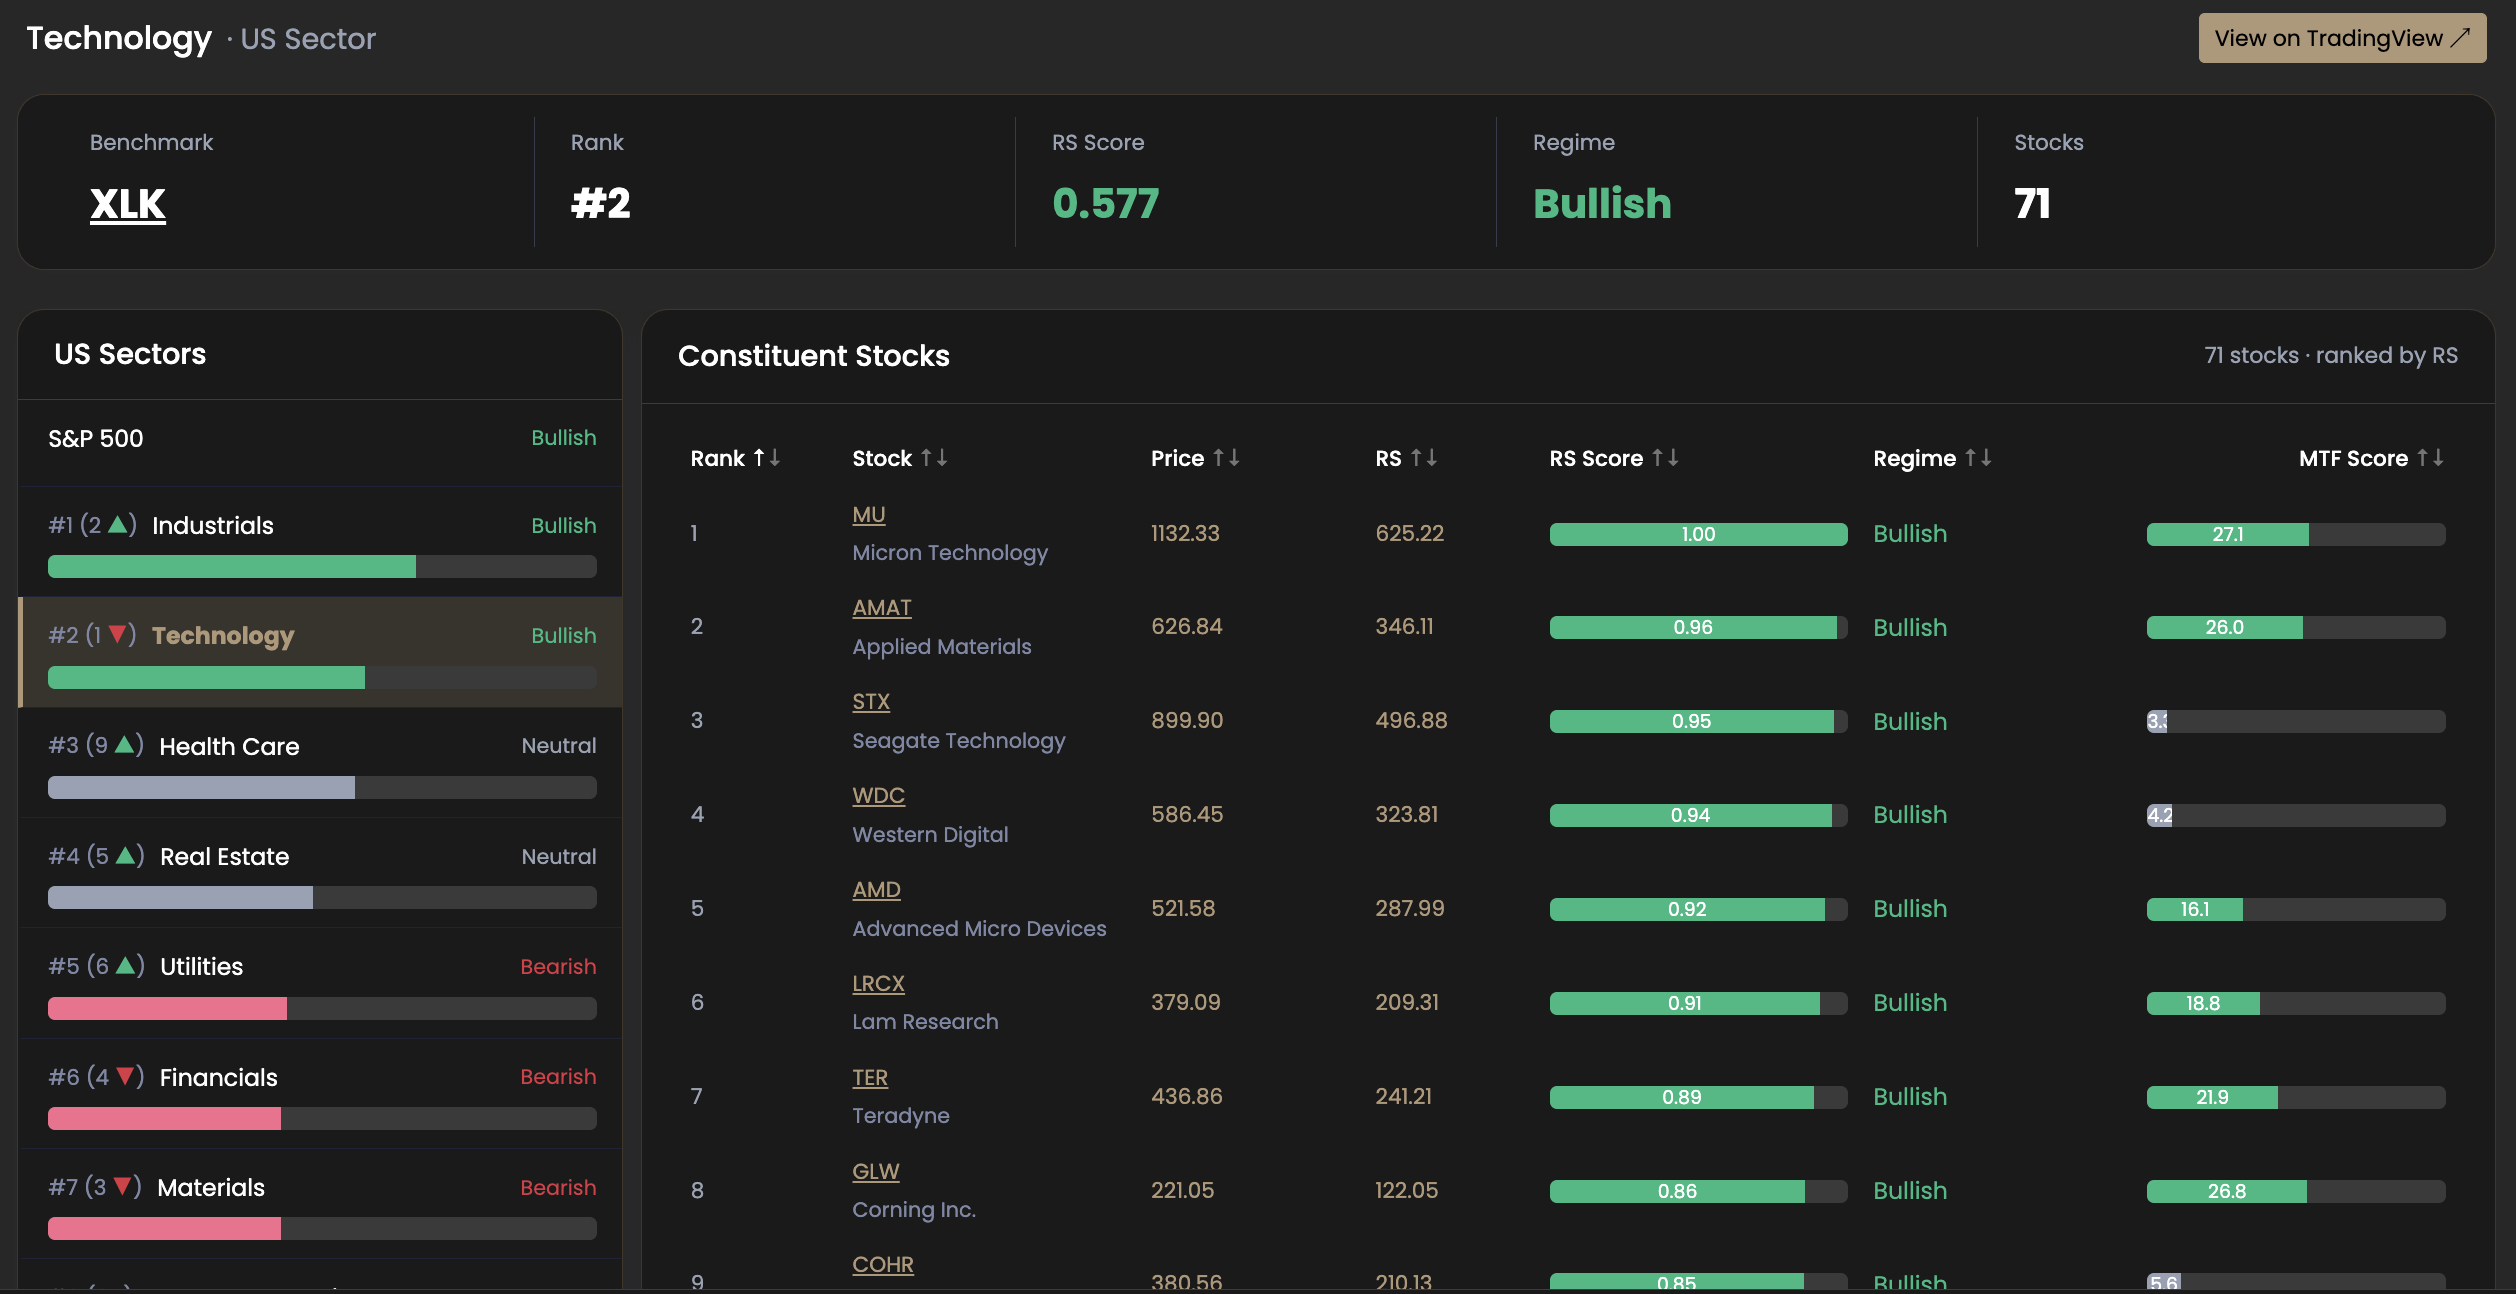 US Technology sector (XLK): Rank #2 with RS 0.577, Bullish regime. AMAT sits at Rank 2 with Altra Score 26.0
The US Technology sector page (benchmark: XLK) confirms the sector's position. It ranks #2 across all S&P 500 sectors with an RS score of 0.577 and a Bullish regime. 71 stocks make up the sector, all ranked by RS.
The constituent table is particularly striking here. The top of the table is dominated by semiconductor and semiconductor-adjacent names — Micron (MU) at #1, Applied Materials (AMAT) at #2, Seagate (STX) at #3. These aren't random — they reflect where institutional money is concentrated within an already-leading sector.
AMAT's RS score reads 0.96 out of a maximum of 1.00 — effectively at the top of the sector's RS distribution. Its Altra Score of 26.0 is visible directly in the ranking table, flagged Bullish.
Step 3 — Evaluate the Stock
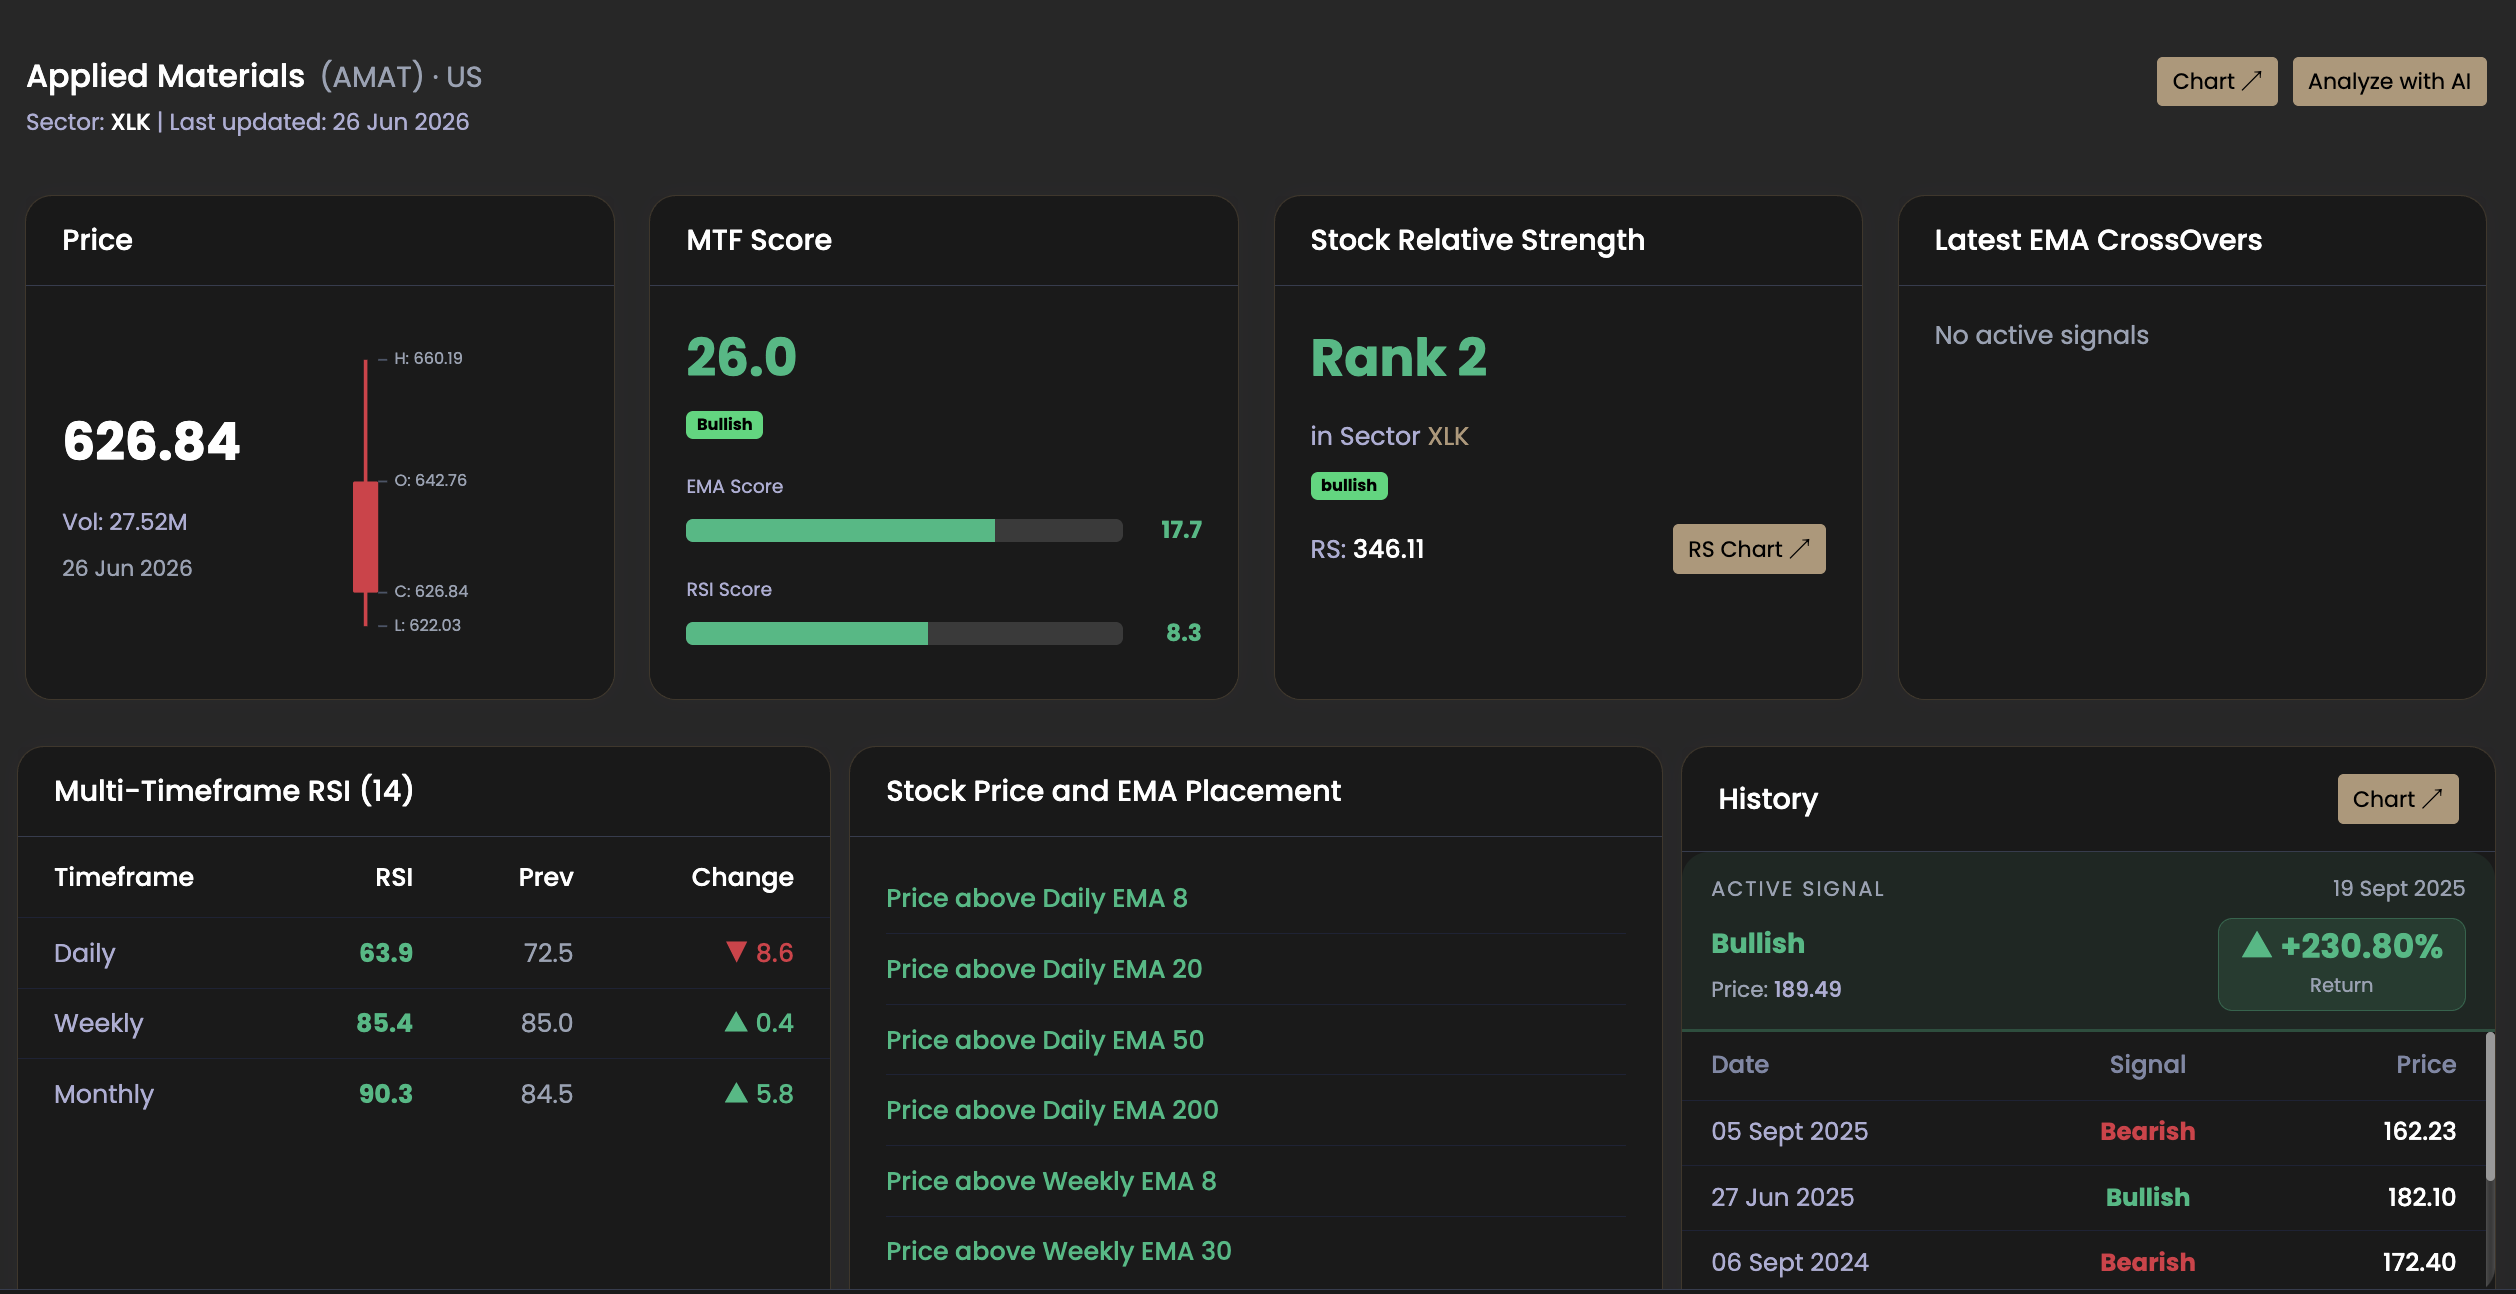 Applied Materials stock page: Altra Score 26.0, RSI rising across all timeframes, active Bullish signal since Sep 2025 at $189.49
The AMAT stock page shows the strongest individual momentum picture of the three examples. Altra Score is 26.0 — well above the Bullish threshold. EMA Score is 17.7, RSI Score is 8.3.
Multi-timeframe RSI: Daily at 63.9 (down 8.6 from a recent high, normal cooling), Weekly at 85.4 (up 0.4), Monthly at 90.3 (up 5.8). The monthly RSI rising to 90.3 is a strong signal of sustained long-term momentum. Price is above every key daily and weekly EMA without exception.
The signal history is what makes this example particularly instructive. A Bullish EMA crossover signal triggered on 19 September 2025 at $189.49. The current price is $626.84 — a return of +230.80% on the active signal. This is the compounding effect of catching a stock early in a leading sector during a healthy market, and staying with the position through three layers of continued confirmation.
Verdict for AMAT: Market Bullish (breadth 65.1, improving) → Sector Bullish (Tech, Rank #2) → Stock Bullish (Altra Score 26.0, Rank 2 in XLK, RS 346.11). Full alignment across all three steps. Highest conviction configuration in the framework.
Example 3: Royal Bank of Canada / RY (TSX)
Step 1 — Check the Canadian Market
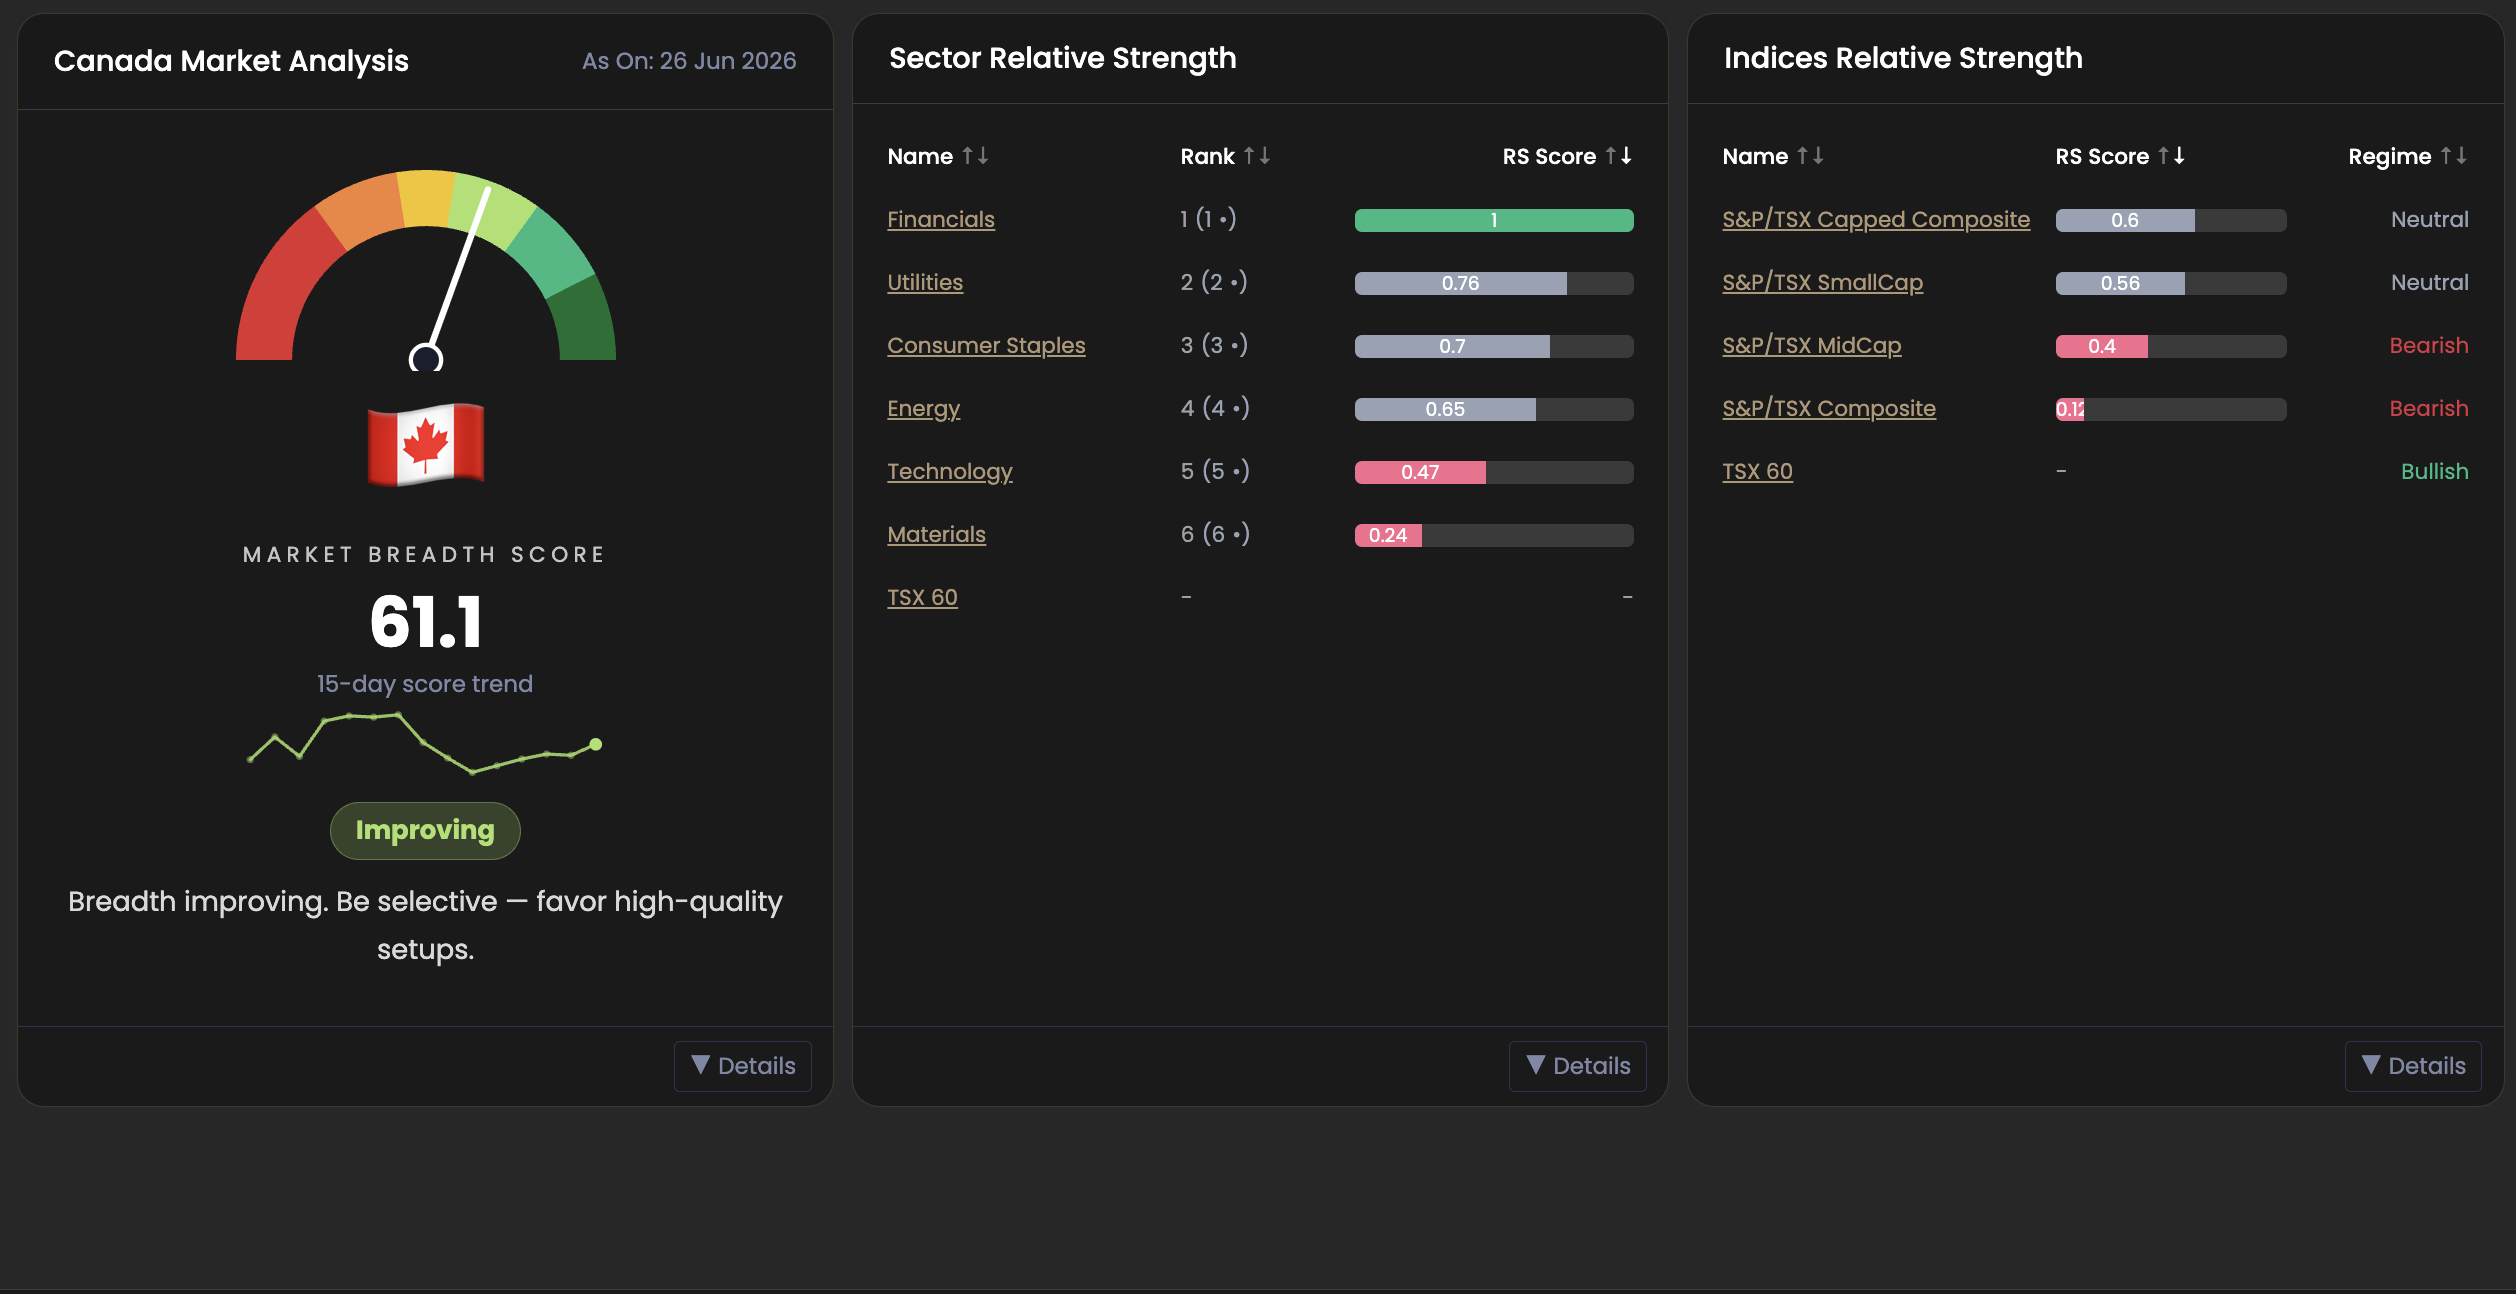 AltraOne's Canada market page as of 26 Jun 2026 — breadth score 61.1, Improving, Financials ranked #1 with a perfect RS score of 1.0
Canada's market sits at a breadth score of 61.1, just above the Bullish threshold, with a trend described as Improving. The guidance mirrors the US reading: "Be selective — favour high-quality setups."
The sector RS table on the market page tells an immediately clear story. Financials holds the top spot with an RS score of 1.000 — the maximum possible, meaning it is outperforming every other sector by the widest margin in the ranking. Utilities is #2, Consumer Staples #3. Technology is #5 and Bearish; Materials is #6 and Bearish. The TSX's structural concentration in Financials and its current leadership make it the obvious entry point.
The Indices RS panel on the right is also worth noting: TSX 60 is Bullish, but the S&P/TSX Composite and MidCap indices are Bearish — a reminder that breadth within Canada is concentrated at the large-cap end, which further reinforces focusing on the strongest sector's strongest names.
Step 2 — Enter the Leading Sector
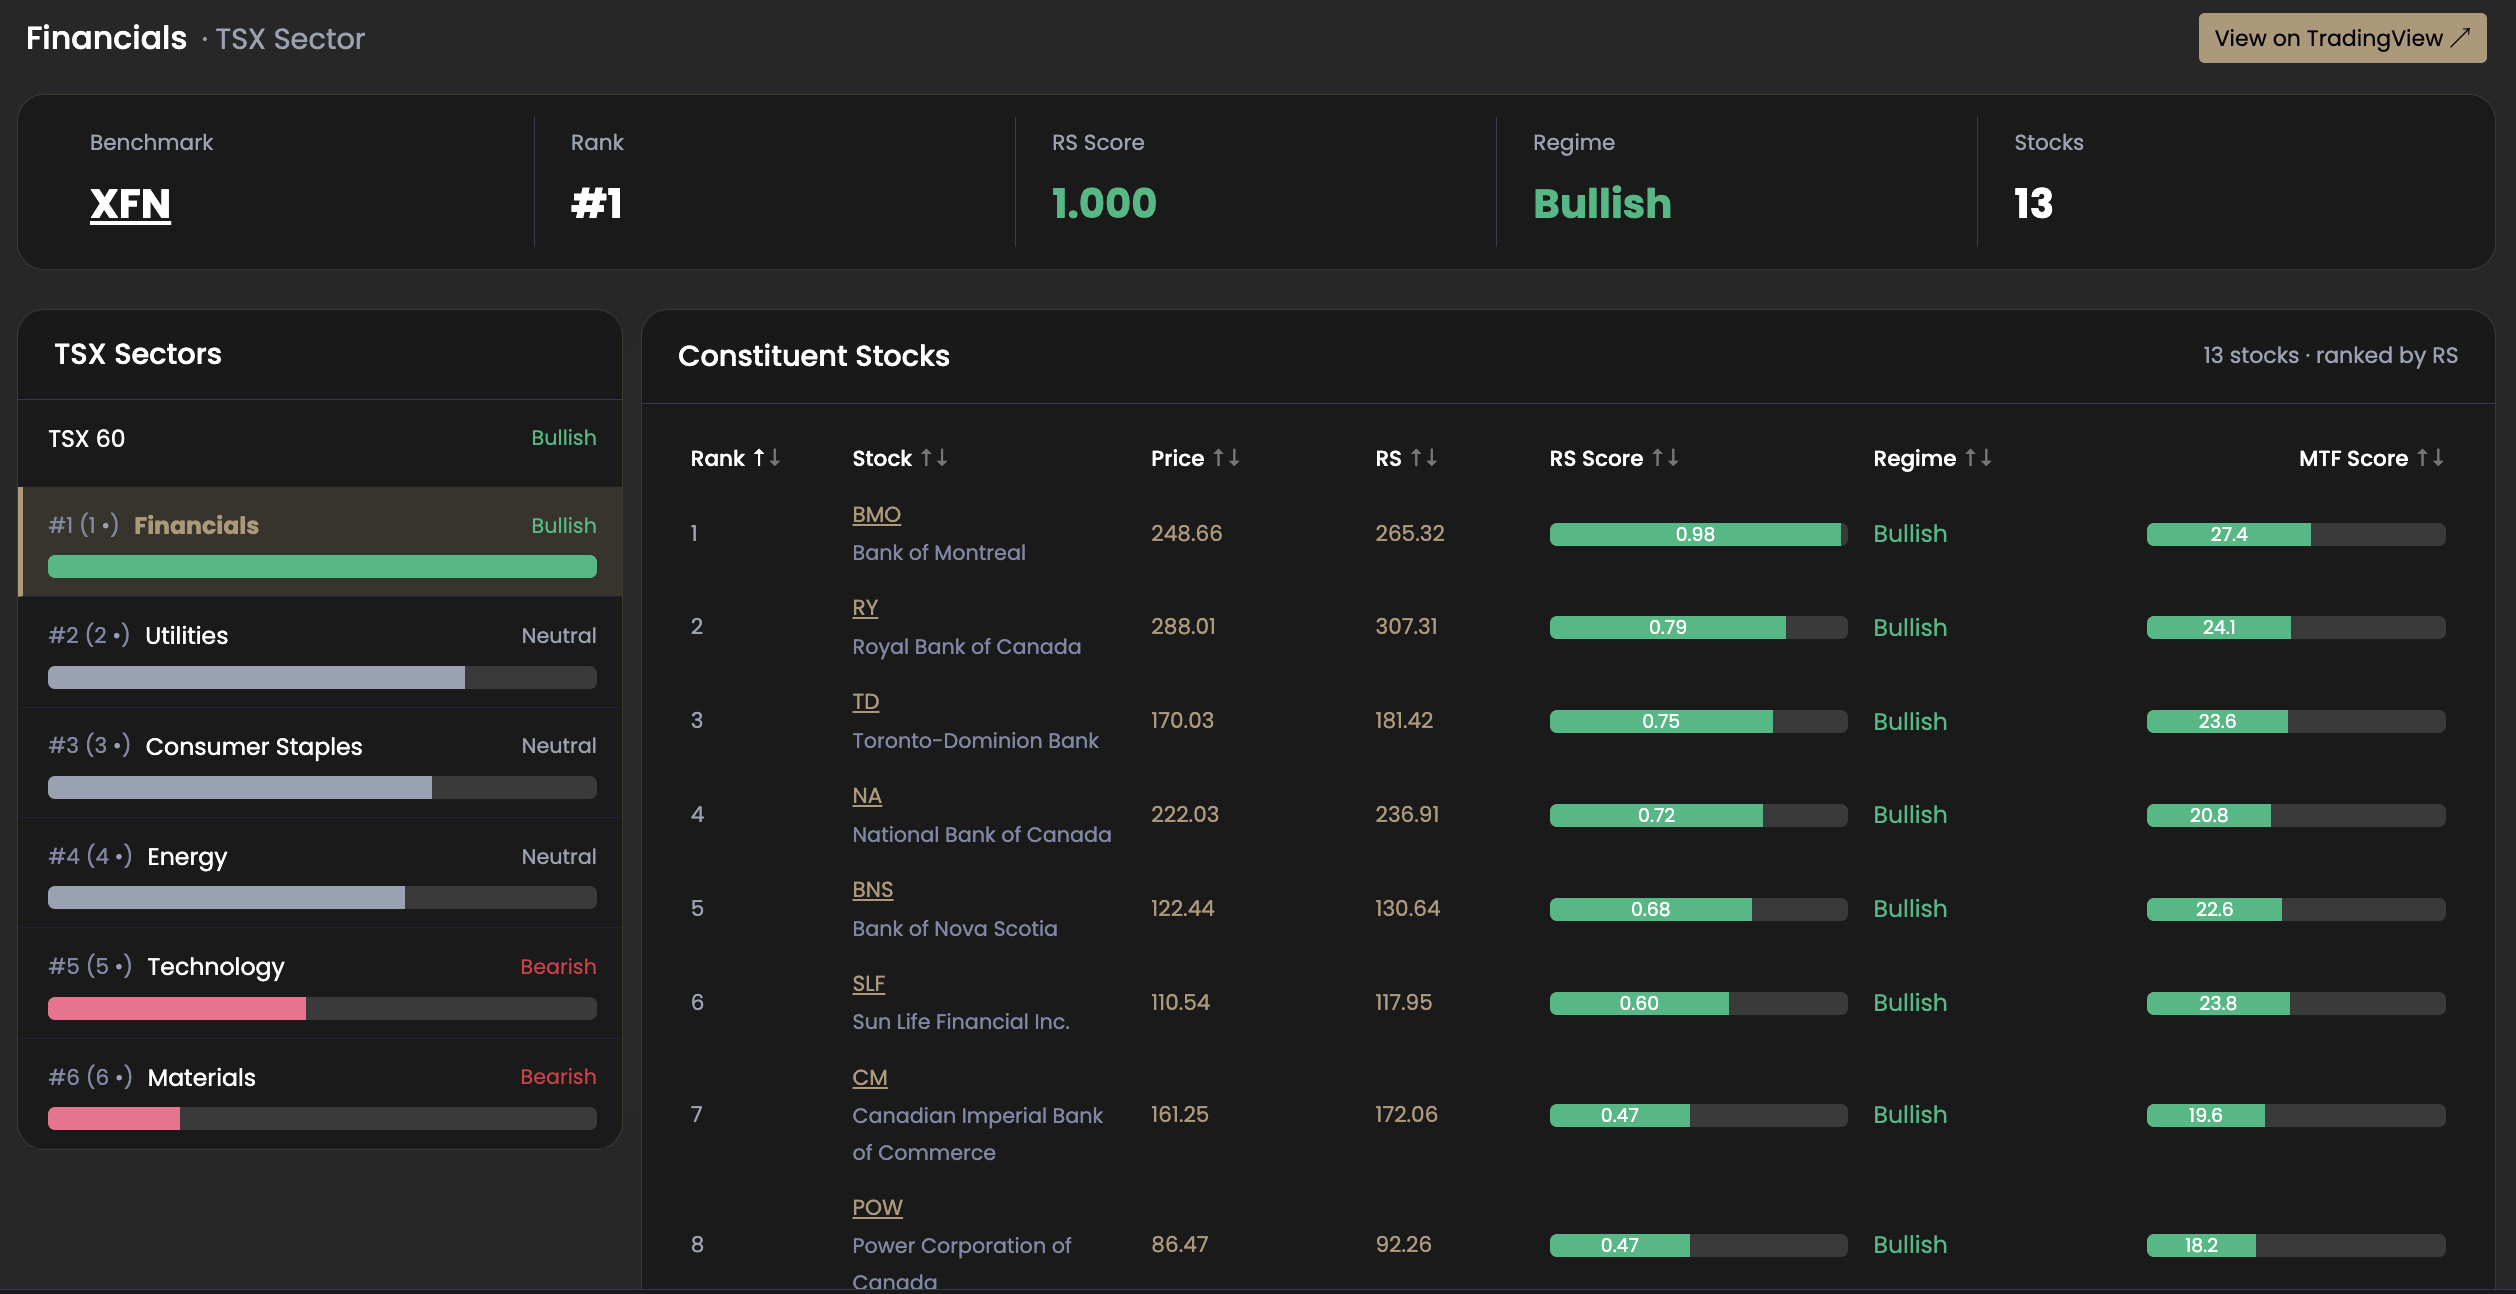 TSX Financials sector (XFN): Rank #1, perfect RS score of 1.000, Bullish regime. RY sits at Rank 2 with Altra Score 24.1
The Financials sector page (benchmark: XFN) shows a sector firing on all cylinders. Ranked #1 across all TSX sectors, RS score of 1.000, regime Bullish, 13 constituent stocks.
The constituent table shows Bank of Montreal (BMO) at #1 with Altra Score 27.4, Royal Bank (RY) at #2 with Altra Score 24.1, TD at #3 with Altra Score 23.6. The top three stocks in the top-ranked sector are tightly clustered in RS and Altra Score — all Bullish, all above 23. This is a sector with genuine broad participation among its leaders, not a single outlier pulling up the average.
RY's RS score of 0.79 places it solidly in the upper half of the sector distribution with a Bullish regime confirmed.
Step 3 — Evaluate the Stock
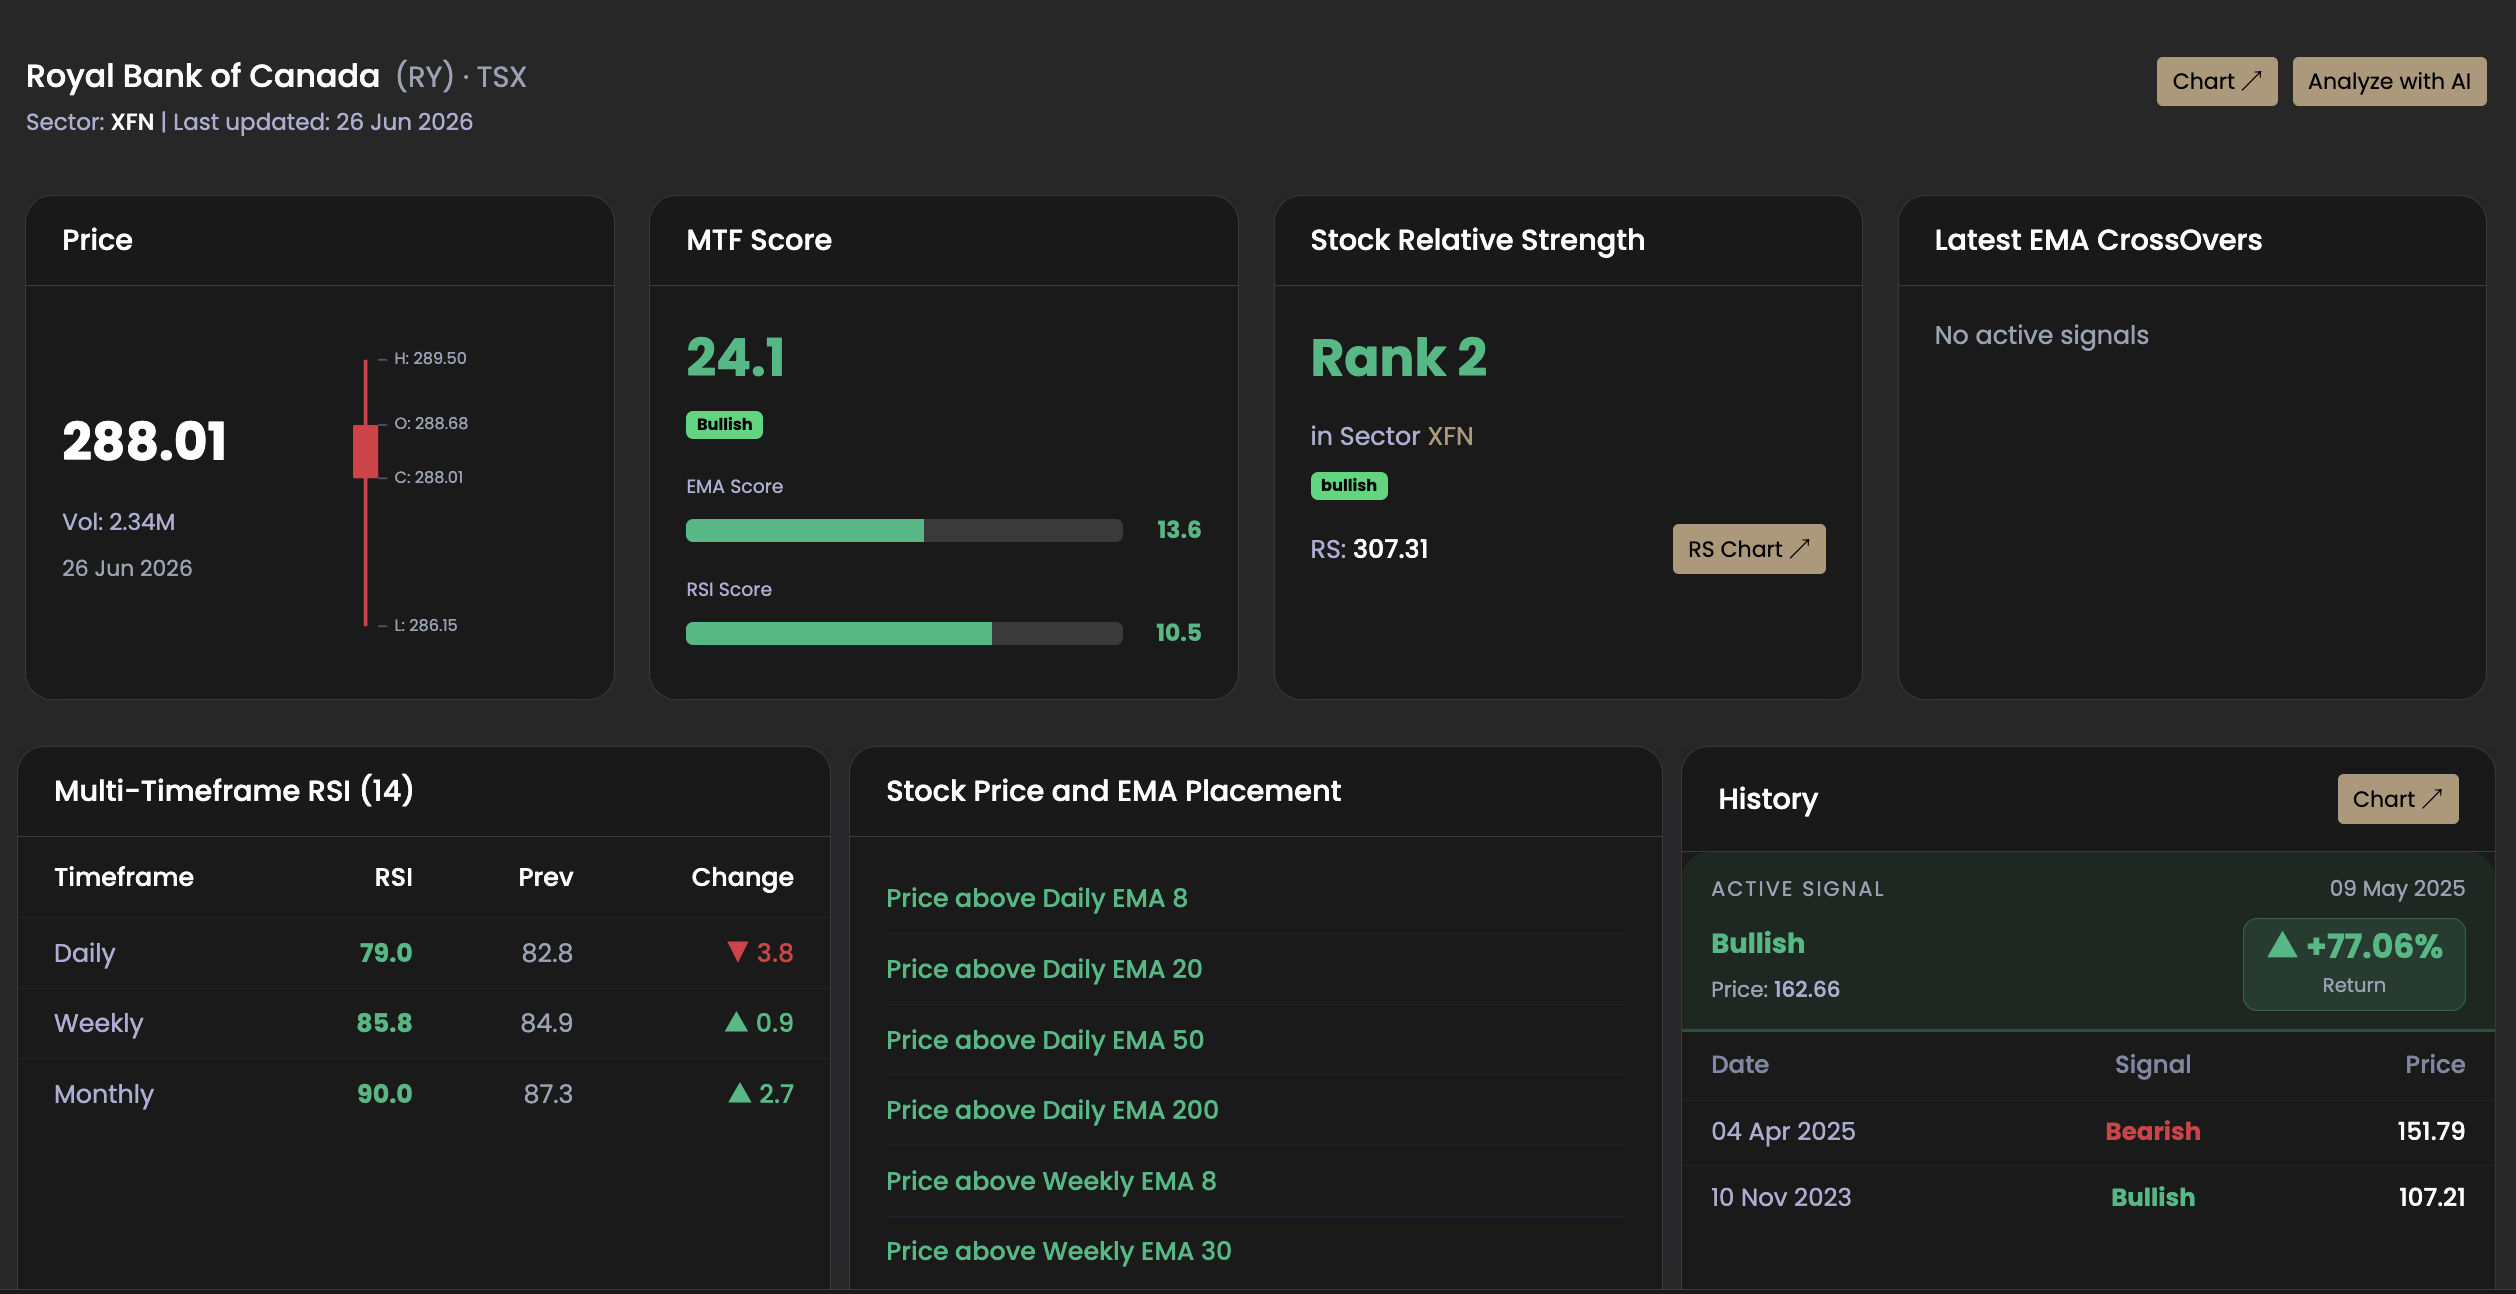 Royal Bank of Canada stock page: Altra Score 24.1, RSI at 79/85/90 across daily/weekly/monthly, active Bullish signal since May 2025 at $162.66
RY's stock page rounds out the picture. Altra Score of 24.1 — Bullish. EMA Score 13.6, RSI Score 10.5. Multi-timeframe RSI: Daily at 79.0, Weekly at 85.8 (rising), Monthly at 90.0 (rising). All three timeframes showing RSI above 79 and trending upward — consistent with a stock in sustained institutional accumulation.
Price is above all daily EMAs (8, 20, 50, 200) and all weekly EMAs. No cracks in the EMA structure.
The signal history shows a Bullish crossover triggered in May 2025 at $162.66. Current price: $288.01. Return on active signal: +77.06%. The framework identified RY's entry in the context of a #1 sector in a Bullish market — and the position has compounded over 13 months.
Verdict for RY: Market Bullish (61.1, improving) → Sector Bullish (Financials, Rank #1, RS 1.000) → Stock Bullish (Altra Score 24.1, Rank 2 in XFN). Full alignment. The strongest possible sector context on the TSX, with a stock confirmed across every layer.
What These Three Examples Show in Common
Three different markets, three different sectors, three different stocks — but the same pattern in each case:
The framework filtered first, then confirmed. None of these stocks was found by scanning for chart patterns. They surfaced by following the hierarchy — market to sector to stock — and the individual stock analysis was the final validation, not the starting point.
Alignment across layers compounds conviction. A Bullish stock in a Bullish sector in a Bullish market is a different trade from a Bullish stock in a neutral sector in a Mixed market. Axis Bank is a good example: strong stock, strong sector, but a Mixed market means the position deserves smaller sizing and more caution. AMAT and RY, with full alignment at all three levels, represent higher-conviction configurations.
The Altra Score and the Altra Sector Score work together. The Altra Score tells you about a stock's own momentum across timeframes. The Altra Sector Score (sector RS) tells you whether the institutional flows behind that stock are working in your favour. Both are needed — a high Altra Score in a Bearish sector is a warning, not an opportunity. For a deeper look at how sector RS is measured and why it matters, see Sector Relative Strength Ranking: The Foundation of Momentum Stock Picking.
How to Run This Yourself on AltraOne
The same workflow runs identically for any stock across all three markets:
- Open the market page for your exchange — India, US, or Canada — and read the breadth score and sector RS summary.
- Click into the top-ranked sector and scan the constituent stock table by RS score and Altra Score.
- Open the stock pages for the top-ranked names and check Altra Score, multi-timeframe RSI direction, and EMA placement.
- Combine all three layers into a verdict: full alignment is the highest-conviction setup; misalignment at any layer calls for caution or avoidance.
No signup required. All data refreshes daily at market close.
FAQ
What does it mean if the market is Mixed but the sector is Bullish?
This is Axis Bank's situation. A Mixed market (breadth 40–60) means overall participation is uneven — some sectors are leading strongly while others are dragging. In this environment, opportunities still exist in leading sectors, but position sizing should be reduced. The risk is that a broad market deterioration pulls even strong sectors down with it. AltraOne's framework doesn't block trades in this environment — it flags the context so the trader can adjust size accordingly.
What if a stock has a high Altra Score but its sector is Bearish?
This is a divergence — and one to treat with caution rather than excitement. Occasionally, a stock can show strong individual momentum while its sector lags the market. This sometimes precedes a sector rotation (the stock is early), but more often the sector headwind eventually wins. AltraOne notes this divergence in its analysis but still classifies the overall setup as Neutral rather than Bullish. Until the sector RS confirms, the tailwind is absent.
How often does the sector ranking change?
Sector rankings update daily with end-of-day data. The broad regime (Bullish / Neutral / Bearish) tends to be stable over weeks to months — it doesn't flip on a single day's price action. However, the precise rank order among similarly-positioned sectors can shift more frequently. Checking the sector ranking page weekly is sufficient for swing and positional traders. For positional traders holding over months, a monthly review is adequate.
Is the Altra Score the same across all three markets?
Yes — the Altra Score is calculated using the same composite methodology across NSE, S&P 500, and TSX. It combines EMA-based and RSI-based signals across daily, weekly, and monthly timeframes into a single score. The Bullish threshold (above 15) and Bearish threshold (below -15) are consistent across all markets, making it directly comparable.
Can I use AltraOne for intraday trading?
AltraOne is an end-of-day (EOD) screener. Data updates after market close and is not real-time. The framework is designed for swing traders (trades held days to weeks) and positional traders (weeks to months). The market breadth score, sector RS rankings, and Altra Scores are most meaningful at these timeframes. Using the sector regime as directional context for intraday setups is reasonable, but intraday entry and exit decisions require real-time tools outside AltraOne's scope.
Start with the market. Then the sector. Then the stock. Try the 3-step framework yourself across NSE, S&P 500, and TSX — free, no signup needed.